Assessment of piping in the northern Meuse Valley in Limburg, the Netherlands
Piping is a critical failure mechanism in dikes, whereby water flows under the dike, taking sand grains with it. It can lead to dike failure. In the Netherlands, piping is assessed using the Sellmeijer design rule. However, fewer cases of piping were observed during the Limburg floods of July 2021 than expected. This discrepancy raises questions about the assessment method for dikes in Limburg.
When piping occurs, a channel (pipe) is created under the dike by backward erosion. The water, containing sand particles, rises on the inside of the dike. Piping can lead to weakening and eventually failure of the dike (see Figure 1). The place where water and potentially sand particles flow out landside of the dike is called a sand boil.
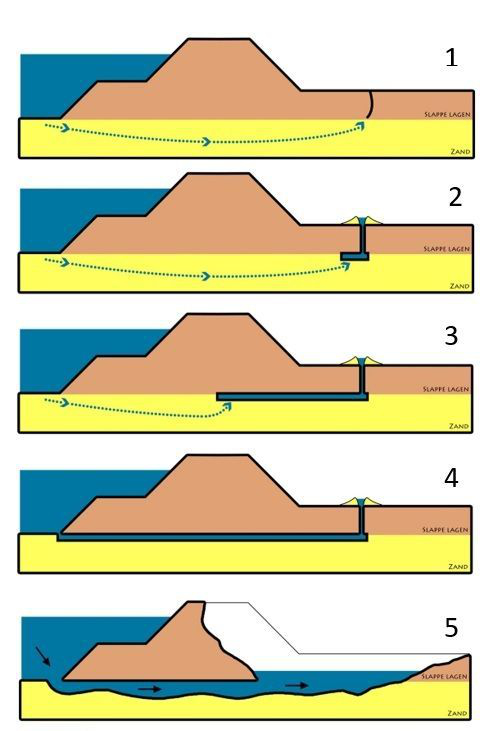 Figure 1. Development of the piping failure mechanism [1]
Using the Sellmeijer design rule, it is possible to calculate the gradient or water level critical to piping. The rule, developed in 1988 [1], is based on a mathematical model. The current version (2011) was optimised based on a series of experiments, which improved accuracy [3] but at the same time limited the scope of application. It is only applicable to dike sections with a grain size (d70) of the piping-sensitive soil layer between 150 and 430 μm.
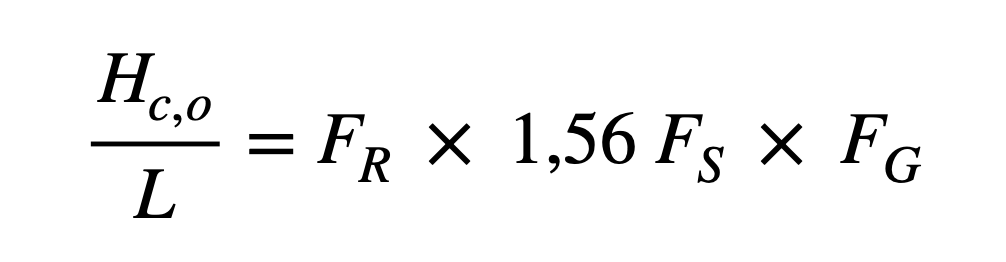
Sellmeijer’s rule is set out in the Statutory Assessment Instruments for Primary Flood Defences [Wettelijk Beoordelingsinstrumentarium] (WBI2017) [9] and is as follows:

: the critical gradient over the dike or the critical water level for piping
: a reduction factor that takes into account the resistance of the dike material

: a safety factor that provides additional security against unexpected circumstances

: a geometry factor describing the influence of the shape and dimensions of the dike.
Limburg as an exception
The problem with the current version of the Sellmeijer design rule for piping is that it does not hold for Limburg. The rule is conservative, meaning that the risks are overestimated. The soil in Limburg consists in many places of coarse sandy and gravelly layers, which have a higher resistance to piping. The water board therefore applies an additional multiplication factor of 1.8 to allow for a less conservative critical water level [5]. This enables the water board to still estimate the risk of piping.
July 2021: less piping than expected
In July 2021, extreme rainfall flooded the floodplains in Limburg, with river water reaching the crest of the dike in some locations. The dikes were not designed to cope with such a high water level, leading to the expectation of many sand boils. However, only 13 boils were reported along the Meuse in Limburg and Brabant [4]. This raises the question of whether the current assessment method is adequate in Limburg. Research has therefore been carried out to evaluate the applicability of the Sellmeijer design rule (including the additional factor of 1.8) in the northern Meuse Valley in Limburg and improve it if necessary.
Research sites
The study included four dike sections, at Well, Hout-Blerick, Buggenum and Thorn. These sites are potentially vulnerable to piping for two reasons: 1) the thin top layer that can rupture and 2) the presence of a thin fine-grained layer above a package of highly permeable soil.
We performed both analytical calculations and calculations with a numerical groundwater model. The groundwater models were developed based on the soil layer classification of the study sites using the COMSOL Multiphysics software [6]. They were then calibrated using head measurement series from the July 2021 floods. By following this process, efforts were made to develop the best possible model for each site, in which the head calculated using COMSOL corresponds as closely as possible to water pressure and monitoring well data (Figure 2).
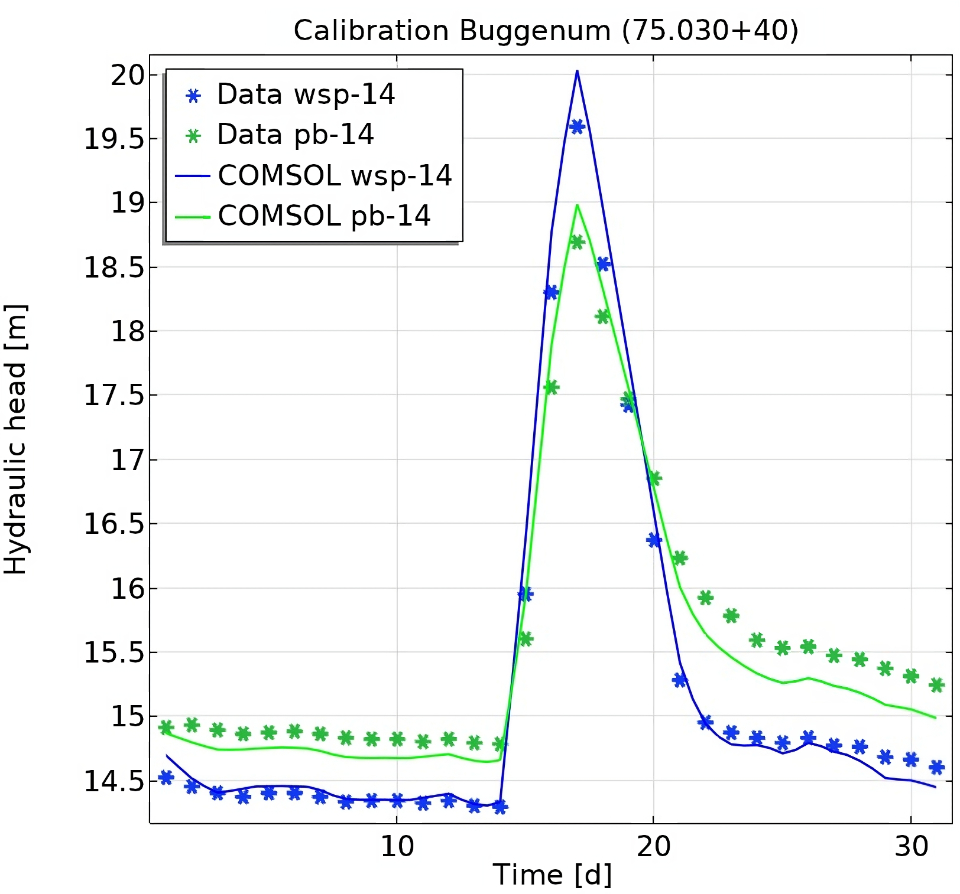 Figure 2. Calibration of the COMSOL groundwater model for the Buggenum site using water pressure (wsp-14) and monitoring well data (pb-14).
Piping in the groundwater model
The groundwater model [7] assumes a steady state between two factors:
the horizontal pressure gradient on the sand grains at the bottom of the pipe (caused by the hydraulic gradient, i.e. the slope of the pipe)
the rolling resistance of the grains.
The model calculates the pipe height (expressed in number of sand grains) at which the pressure gradient exceeds the rolling resistance of the grains and the grains start moving, assuming piping occurs at this time.
Van Esch et al. (2013) [8] have shown that the pipe height for dikes ranges from 3 to 30 grains. This study therefore assumes that piping can occur when the average pipe gradient exceeds the critical gradient for a realistic pipe height, where a realistic pipe height is at least 3 grains.
Results
For the Well, Hout-Blerick and Thorn sites, the outcome of the model calculations is that piping can only occur at a pipe height of one or two grains, or the smallest possible pipe height. According to both the literature and common sense, such theoretical pipe heights do not lead to piping.
The outcome for Buggenum is that piping can occur at a pipe height of 4.5 grains or smaller. A small sand boil was observed near Buggenum in July 2021. This indicates that the critical gradient, at which sand grains are carried away from the aquifer to ground level, can indeed occur here and so too, in theory, can backward erosion. The calculated pipe height is low compared to observations in field tests, which may also apply to the risk of piping.
Improving Sellmeijer’s rule for Limburg
The consistency between the observed water levels and sand boils, the calibrated Buggenum model and the literature leads to the conclusion that the Sellmeijer concept does essentially hold for the piping problem in Limburg. This means that an analytical calculation rule can be formulated to describe the problem. However, according to the Statutory Assessment Instruments [Wettelijk Beoordelingsinstrumentarium] (WBI2017) [9], the grain sizes of the dikes at the study sites in Limburg fall outside the scope of application of Sellmeijer’s design rule (150 μm ≤ d70 ≤ 430 μm).
To expand the scope to include Limburg, a stochastic analysis was carried out. This involved assessing 1000 randomly generated dike sections for piping, using the proposed COMSOL model. These dike sections consist of collections of model parameters randomly selected from a realistic range. In terms of grain diameters, the range for this exercise was set at 100 to 900 μm. This range was selected to ensure that the grain size corresponding to the soil composition of the northern Meuse Valley in Limburg now falls within the scope of application. The scope is therefore larger than for the current Sellmeijer design rule.
 Figure 3. Linear regression between Sellmeijer scale factor (Fs) of the stochastic analysis (FS,stoc) and associated with the critical gradient (FS,eq), leading to the derivation of factor 1.56
A linear regression analysis of the results of this stochastic simulation shows that the Sellmeijer design rule can be applied to dikes with parameter values within the scope of application broadened by a factor of 1.56. This factor must be added to the original 1998 Sellmeijer design rule [2]. The reason for this is that the factor was derived solely on the basis of a mathematical model and is more broadly applicable than the 2011 revised version. The improved Sellmeijer design rule is then as follows:
New design rule in practice
The improved design rule can be applied not only in Limburg, but to all dikes whose parameter values fall within the adjusted scope (grain size 100-900 μm). The study shows that it is possible to assess piping analytically for dike sections outside the scope of application of the current Sellmeijer design rule. This addresses the need for a conventional assessment method for piping.
Further research should be carried out to determine the extent to which choices in schematic representation and the scarcity of measurement results and observations affect the predicted probability of piping.
Practical relevance
Around ten years ago, an inspection round of the dikes along the Meuse in Limburg indicated that piping was regularly a major failure mechanism [8]. This was a contributing factor in the decision to reject a significant number of flood defences. The most recent round in 2022 found that 20% of primary flood defences in Limburg are non-compliant, while compliance is uncertain for another 14%. Given that dike reinforcement is very costly, this means that a more accurate assessment of the probability of piping could result in considerable savings.
This article is based on final thesis research carried out at TU Delft on behalf of Arcadis[11]. To read the research in full, visit: http://resolver.tudelft.nl/uuid:b3f1fa37-480f-4cc6-9fc5-a6f6e3eed497.
Sanne van Dijk
(TU Delft)
Rimmer Koopmans
(Arcadis)
Juan Aguilar Lopez
(TU Delft)
Background picture:
Sandbags on the dike near Buggenum during the Limburg floods of July 2021
Summary
In the Netherlands, the probability of dike piping is assessed using the Sellmeijer design rule. A modified version is used for the Meuse Valley in Limburg due to a different soil composition. However, much less piping than expected was observed during the extreme floods in Limburg in July 2021. This study investigated this discrepancy, leading to a further adjustment of the design rule. This may lead to fewer dike reinforcements in Limburg, but further research is needed.
Literature
1. Deltares. (2013). Onderzoeksrapport Zandmeevoerende Wellen [Research report on sand boils]
2. Sellmeijer, J. (1988). On the Mechanism of Piping under Impervious Structures
3. Sellmeijer, J., J, L., S, L., van Beek, V., & Knoeff, H. (2011). Fine-tuning of the backward erosion piping model through small-scale, medium-scale and IJkdijk experiments. European Journal of Environmental and Civil Engineering, 15:8, 1139-1154. doi: 10.1080/19648189.2011.9714845
4. ENW. (2021). Hoogwater 2021 Feiten en Duiding [2021 Flood Facts and Interpretation] (Vol. 2). Retrieved from https://www.enwinfo.nl/publicaties
5. Van Beek, V. (2018). Grind en grindhoudende lagen in de Maasvallei [Gravel and gravel-bearing layers in the Meuse Valley]. Deltares memo 11202002-002- GEO-0002. Deltares [Unpublished].
6. COMSOL AB, 2019. COMSOL Multiphysics v. 5.4. reference manual
7. Aguilar-López, J., Warmink, J., Schielen, R., & Hulscher, S. (2016a). Piping erosion safety assessment of flood defences founded over sewer pipes. European Journal of Environmental and Civil Engineering, 22(6), 707-735. doi: 10.1080/19648189.2016.1217793
8. Van Esch, J., Sellmeijer, J., & Stolle, D. (2013). Modelling transient Groundwater Flow and Piping under Dikes and Dams. 3rd International Symposium on Computational Geomechanics (ComGeo III)
9. Deltares (2018). Basic report WBI 2017, v1.2
10. HKV (2024). Wettelijke beoordeling van de waterkeringen langs de Limburgse Maas [Statutory assessment of flood defences in the Limburg Meuse region]. Url: https://www.hkv.nl/actueel/wettelijke-beoordeling-van-de-waterkeringen-langs-de-limburgse-maas
11. Van Dijk, S.E. (2023). Sellmeijer in the northern Maasvallei. TU Delft Master Thesis. Civil Engineering & Geosciences.
^ Back to start