CONTENTS

Knowledge journal / Edition 1 / 2018

PREFACE

Water Matters: research with a view to a practical application

In front of you is the seventh edition of Water Matters, the knowledge magazine of the journal H2O. You will find ten articles about a variety of subjects, written by Dutch water professionals on the basis of thorough research.

Repeated appeals and a personal approach have resulted in sufficient proposals for articles in order to enable the editorial board to make this selection. The board mainly looked at a clear relation with the daily practice in the water sector. Research, results and findings must be new and produce articles which present new knowledge, insights and techniques with a view to a practical application.

This edition also offers a wide range of subjects: from underground storage in order to be able to recover fresh water in salinated areas to coastal protection by means of natural mangrove recovery. Other articles concern: powdered activated carbon in activated sludge in order to remove micro-pollutants, detailed monitoring in space and time for an effective area-focused approach to nutrient losses, a model approach to quantify the effect of ground water extraction on subsidence in the Mekong Delta and marble filtration as a technique for removing anthropogenic substances.

Like the journal H2O, Water Matters is an initiative of the Royal Dutch Water Network [Nederlands Waternetwerk (KNW)], the independent knowledge network for and by Dutch water professionals. Members of KNW receive Water Matters twice a year as a supplement with their H2O journal.

The publication of Water Matters is made possible by prominent players in the Dutch water sector. These Founding Partners zijn ARCADIS, Deltares, KWR Watercycle Research Institute, Royal HaskoningDHV, Stichting Toegepast Onderzoek Waterbeheer (STOWA) and Wageningen Environmental Research (Alterra). With the publication of Water Matters, the participating organizations wish to make new, applicable water knowledge accessible.

You can also read Water Matters in digital form at H2O-online (www.h2owaternetwerk.nl). This publication is also available as a digital magazine in the English language via the same website or via www.h2o-watermatters.com. The English publication is partly made possible by the Netherlands Water Partnership (NWP), the network of approximately 200 collaborating public and private organizations in the area of water.

The articles in English can also be shared from the digital magazine at H2O-online. Furthermore, articles from previous editions can be found on the site.

We hope you enjoy reading this edition. If you have any comments, please let us know via redactie@h2owaternetwerk.nl.

Monique Bekkenutte Publisher (H2O Foundation)
Huib de Vriend Chairman editorial board of Water Matters

PREFACE

Practical application

Knowledge journal / Edition 1 / 2018

Sustainable freshwater supply thanks to a combination of underground storage and desalination


Keeping freshwater available for greenhouse horticulture in saline coastal areas is not an easy task. There is a sustainable solution, where precipitation excess during the winter period is utilized as optimally as possible by storing the water underground.

In saline groundwater environments with a large water demand, such as the Westland, greenhouse horticulture uses rainwater as its primary water source. However, the storage capacity in aboveground reservoirs is generally insufficient for effectively collecting all the rainwater from wet periods. For this reason, in addition to rainwater, use is made of brackish groundwater to provide greenhouse horticulture in particular with high-quality freshwater (sodium concentration < 10 mg/l). The brackish groundwater is pumped up, then about half of the volume is converted via reverse osmosis (RO) into freshwater and the other half containing the salts (‘concentrate’) is returned into deeper groundwater layers (aquifers). This brackish water extraction and concentrate disposal has the risk that the salination of the groundwater will be reinforced and is for that reason under pressure in terms of policy.
In less saline areas, underground storage of (winter) precipitation excess offers a sustainable alternative. The excess precipitation from greenhouse roofs is infiltrated and stored via wells in the underground. In periods of shortage this water is recovered. This technique is known by the name of aquifer storage and recovery (ASR). In saline groundwater environments, such as the Westland, this technique can be applied to a moderate extent, because due to density differences the relatively light fresh infiltration water floats upwards during storage in the brackish aquifer. The freshwater is therefore difficult to recover unmixed. In this article, we present a concept where ASR and desalination of brackish groundwater by means of Reverse Osmosis (RO) have been combined. This combination (‘ASRRO’) has the aim of offering a sustainable, technically and economically feasible alternative to the current practice. The set-up was tested at a tomato grower in the Westland in order to research the practical applicability.

Approach: ‘Prominent’ field site

In 2012, the water systems of four greenhouse horticultural companies of growers’ association ‘Prominent’ were linked (see Figure 1). As a result, the excess rainwater of a total of 27 hectare of greenhouse roofs became available. An ASR system was built in order to be able to infiltrate the rain water into a sand layer at a depth of 23 to 37 m, where the ambient groundwater was brackish (approx. 4300 mg/l chloride). The ASR system was fed with the water that would otherwise be discharged (unused) from the rainwater reservoirs of the horticulturalist. There was an attempt to keep these reservoirs at a filling degree of approx. 70-90%, so that a storage of at least approx. 20 mm remained for the collection of precipitation. Prior to infiltration, suspended solids were removed from the water using a slow sand filter. The ASR system was designed to be able to recover a maximum of freshwater, despite upward floating and mixing. To this end, a number of adjustments have been introduced in relation to a simple ASR system (see Figure 2):
1. Water could be infiltrated in and recovered from the aquifer at three different depths;
2. The deepest wells could function as ‘Freshkeeper’: an interception well in order to collect approaching brackish groundwater at depth, to protect the shallow extraction of freshwater. The intercepted brackish water was returned to a deeper aquifer (50 – 90 m deep);
3. There was the option of desalinating the recovered water again, when mixing of freshwater with brackish water had occurred (from May 2015). This water was extracted by means of ASR wells (in the heart of the inserted freshwater bubble: ‘ASRRO’). In addition, this mixed water was also extracted with the already present extraction well belonging to the desalination system of Prominent (on the edge of the freshwater bubble: ‘BWRO’: brackish water RO). The remaining ‘concentrate’ after desalination was disposed into a deeper aquifer (50 – 90 m deep).
The system’s functioning (before, during, after storage) was continually monitored via an extensive network. This involved automatically measuring groundwater recharge and extraction, as well as the salinity (on the basis of electrical conductivity) of the extracted water. By means of sensors, borehole geophysics, and sampling and analysis (macro-chemistry, trace elements, modified fouling index (MFI)) of groundwater at various depths at a distance of 5, 15, 30, 40 and 60 m from the ASR wells, the distribution and the water quality development of stored water was monitored. In addition, a detailed 3-D, density-dependent groundwater model was set up with the model code SEAWAT in order to evaluate the transport processes in the aquifer and to understand the effects on the groundwater system.

Figure 1: Overview of the ASRRO trial at Prominent Groeneweg.


Figure 2: Principle of ASRRO at the site of Prominent. BWRO = extraction via the existing desalination system of Prominent, on the edge of the freshwater bubble.

Results

From the results it appeared that after infiltration of 168 000 m3, a total of 39 000 m3 (23%) could be recovered practically unmixed, for immediate use. This recovery was limited because deeper groundwater could penetrate the aquifer via the borehole of an existing deeper ATES (aquifer thermal energy storage) system near the ASR wells (Figure 1), which could be shown by means of chemical analyses and modelling. This short circuit flow, which occurred by previous human intervention in the substrate, appeared to approximately half the possible unmixed recovery and therefore has a huge impact on the success of ASR in at this location. The remaining water demand was met by desalinating the extracted mixed brackish water / rainwater via RO. This led to a measured production of another 64 000 m3 freshwater, as a result of which a total of 61% of the inserted freshwater was recovered.
In the aquifer, ASRRO did indeed have an effect on the distribution of fresh and saline groundwater. The modelling offered more insight into this. Around the two wells for infiltration and recovery, a freshwater bubble temporarily occurred with a diameter of a maximum of 120 m, observed and confirmed by the model. During dry periods, this freshwater bubble kept on being partially removed for the extraction of unmixed freshwater (immediate use) and mixed freshwater/brackish water (for treatment with RO). Since on average more freshwater was infiltrated than was extracted, it was calculated that the salinity of the groundwater was decreasing. This was confirmed by measurements of the extracted water and the results of the SEAWAT model. The ‘concentrate’ that was released as by-product from the ASRRO and the BWRO therefore also remained relatively fresh. The salinity of the ‘concentrate’ that was disposed into the second aquifer was the same or lower than that of the (brackish) groundwater present in this aquifer (Figure 3).

Figure 3: Modelled chloride concentrations after 3 year’s operation ASRRO Westland. The horizontal dotted lines indicate the location of the first and second aquifer (first of 23 m to 37 m-mv, second from 46 m-mv).

Points of attention and cost price

The infiltration of rainwater had positive effects on the salinity of the groundwater, but also brought clay particles from the aquifer in suspension during the displacement of the ambient brackish groundwater. This increased the turbidity at the edge of the freshwater bubble and lead to blocking of RO membranes when the water was extracted from this zone and fed to the BWRO system (Figure 2). By only extracting deep brackish water (via the deep filters of the ASRRO) and regularly rinsing the membranes with fresh permeate (at the BWRO), blocking could be prevented. In addition to this mobilization of clay particles, the quality of the rainwater is a point of attention. During the field trial, low concentrations of pesticides were observed (almost always <0.1 µg/l per active substance; sum of the concentration <0.5 µg/l). Zinc (in dissolved form, probably originating from the roof constructions) also appeared to be almost continuously present in the infiltration water in a relatively high concentration (average >100 µg/l).
The cost price of water produced via ASRRO turned out to be higher than for conventional desalination of brackish water. However, there are stimulation measures (MIA tax scheme/Vamil scheme) which ensure that for application for horticulturalists the additional costs are reduced. In the case that for infiltration of and production of 30 000 m3/year, a 1/3 part can be recovered unmixed and a 2/3 part must be treated via RO, the costs for ASRRO and conventional brackish water desalination are 0.70 and 0.64 euro/m2 respectively.
This is more interesting than storage of the same volume in an aboveground reservoir (1.37 euro/m3). If no freshwater can be recovered unmixed and the water demand must be produced via RO, the cost price will increase to 0.80 euro/m3. Other benefits (ecosystem services), such as avoided costs for alternative storage for precipitation peaks and the prevention of further salinisation of the aquifer, have not been included.

Conclusions

Continually having freshwater available, for agriculture, public and industry, is a huge task in coastal areas worldwide. Extraction and desalination of brackish groundwater does indeed make freshwater available but has the risk that aquifers will salinise. An alternative is to temporary store freshwater excesses during wet periods in the underground via aquifer storage and recovery (ASR). This technique has been combined with desalinisation via reverse osmosis (RO) to ASRRO, to also be able to recover freshwater under more saline groundwater conditions, without this leading to salinisation. The operation of ASRRO has been shown for greenhouse growers of Prominent in the Westland. Important preconditions for ASRRO are the pre-treatment and the strategy of the recovery and desalination in order to prevent pollution of groundwater and membranes. On a commercial scale, ASRRO will lead to higher, but as anticipated, acceptable costs per m3 of freshwater produced, while further salinisation of the groundwater is prevented.

Koen Zuurbier
(KWR Watercycle Research Institute)
Sija Stofberg
(KWR Watercycle Research Institute)
Marcel Paalman
(KWR Watercycle Research Institute)
Steven Ros
(KWR Watercycle Research Institute)
Gerard van den Berg
(KWR Watercycle Research Institute)

Summary

Keeping freshwater available for the greenhouse horticultural sector in saline coastal areas is no easy task. During dry periods, shortages occur and growers choose desalinated groundwater to supplement their irrigation water provisions. The risk is that as a result aquifers will salinise. In this article, we present a sustainable solution where precipitation excesses during the winter period are utilized as optimally as possible by storing them in the underground. Using a single storage and recovery system, this extra supply of freshwater can partly be used immediately and partly be made suitable after desalination. In this way, both a reliable irrigation water supply and a balance between extraction and infiltration of freshwater occur. Further salinisation of the groundwater is thus prevented.


References


Zuurbier, K.G., Stuyfzand, P.J., 2017. Consequences and mitigation of saltwater intrusion induced by short-circuiting during aquifer storage and recovery in a coastal subsurface. Hydrol. Earth Syst. Sci., 21(2): 1173-1188.

Zuurbier, K.G., Ros, S., Paalman, M., 2017. Valorisation and demonstration of an ASRRO application in a field application. DESSIN, D33.1: 88 p.

Stofberg, S. F., Paalman, M., Zuurbier, K.G. 2017. Evaluation of the improvement of Ecosystem Services as a result of ASR/RO application, DESSIN, D33.2: 56 p.

Stuyfzand, P.J., Raat, K.J., 2010. Benefits and hurdles of using brackish groundwater as a drinking water source in the Netherlands. Hydrogeology Journal, 18(1): 117-130. DOI:10.1007/s10040-009-0527-y

^ Back to start

UNDERGROUND STORAGE

Sustainable freshwater supply

Knowledge journal / Edition 1 / 2018

Remineralisation of Reverse Osmosis permeate for the production of drinking water

Dutch drinking water manufacturers increasingly come across anthropogenic substances in the water that they extract, such as industrial substances, medicine remains and pesticides. Although the concentrations found are still low, the companies are considering new methods of treatment. The salinization of the groundwater and surface water that has undergone bank filtration also forms a considerable challenge. The question is: what method do you choose to remove those substances optimally and how do you then ensure that the water produced is chemically stable again and meets the legal requirements (remineralisation)?

Evides Waterbedrijf and Oasen Drinkwater carried out almost similar research into the application of remineralisation after treatment of surface water and bank filtered groundwater by means of reverse osmosis (RO). The reason for this is that RO permeate is free of impurities, but chemically not stable. Evides and Oasen carried out their research partly independently and partly collectively. The research questions focused on establishing design parameters for the remineralisation process (such as contact time and efficiency of the use of carbon dioxide), as well as the relation between filtration rate and the required drinking water quality, such as the content of hydrogen carbonate and turbidity. They also considered whether the calcium carbonate precipitation of the water produced meets the set requirements.

Company-wide research programme

Despite the high quality of conventional treatments in the Dutch drinking water preparation, it is not always possible to optimally remove all the anthropogenic substances, and it is not possible to remove salt at all. Although the concentrations of these substances in drinking water are still very low and they do not pose a threat to public health, both companies are preparing themselves for the future. Oasen began in 2012 with the research programme Impeccable water with 100% RO and remineralisation Onberispelijk water met 100% RO en remineralisatie (Flawless water with 100% RO and remineralisation), in order to research and develop the company’s new treatment concept on the basis of membrane filtration. Evides began in 2014 with a company-wide research programme into solutions and applications for the future challenges for the production of drinking water (among other things by means of membrane filtration and remineralisation), industrial water and waste water, including the issues regarding the pipeline network.

Removing anthropogenic substances from water

Reverse osmosis (RO) is one of the technologies for extensively removing anthropogenic substances and salt. In the Netherlands, this treatment process is applied to a limited extent and usually the permeate is mixed with conventionally treated water. The application of RO for treating fresh river and bank filtered groundwater, for the sole purpose of removing anthropogenic substances from the water, can be called innovative. In the case of RO, a post-treatment is vital for making the water chemically stable and allowing it to meet the legal provisions. This post-treatment is called remineralisation and ensures that the buffer capacity and hardness reach the required standards. In the case of remineralisation, hydrogen carbonate is dissolved in the permeate by means of the contact with calcium carbonate (marble stone). This raw material can dissolve because the lime aggressiveness of the permeate is high, due to the carbon dioxide present. This carbon dioxide can be naturally present or can be added. After the solution reaction, the remaining carbon dioxide can be removed again by means of a degassing process.

Best available remineralisation method

For Oasen, the main research question was: What is the best available remineralisation method? All possible technologies for this were charted, then a preselection was made (see Table 1). The application of calcium chloride was eliminated due to the high costs and the high CO2 footprint on the basis of Life-Cycle Analysis (LCA). For the practical research, two techniques remained: (conventional) marble filtration and micro calcite dosage. Marble filtration consists of a dissolution reaction by filtration over marble grains. Micro calcite dosage is the dissolution reaction of marble powder and separation by means of membrane filtration. In the latter case, only the dosage option was tested at pilot level. At the time of the research programme, the option of a Membrane Calcite Reactor (MCR) was still not further developed than at lab scale. This option was therefore eliminated since Oasen wishes to be able to implement the best technique in the short term.

Table 1. Summary of pilot research by Oasen into the best available remineralisation method, considered on the basis of water quality, operational parameters, robustness (FMECA), sustainability (LCA) and costs.

Pilot research into remineralisation at low water temperatures

For the pilot research of Evides the main question was: Is it possible to remineralise RO permeate at a low water temperature? And is that a sustainable and workable process? Evides relies largely on surface water from the river Maas, which is stored in the Biesbosch reservoirs in Brabant. The temperature of the surface watercan drop to 2° C during winter time. Little is known about remineralisation at very low temperatures. The question was whether this would have a limiting effect on the reaction kinetics and the dissolution of the minerals required. The optimum operational management and the costs of this process were also considered.

Various remineralisation techniques viewed on the basis of operational parameters

In the pilot set-ups by Evides and Oasen, the various remineralisation techniques on the basis of operational parameters were researched on a scale of 1 to 10 m3 per hour: the efficiency of carbon dioxide usage, energy costs, water quality, failure probability, sustainability and of course the costs. The hypothesis was that marble filtration would not score the best, in particular with regard to the turbidity of the water produced as a result of the leaching of very fine marble particles. However, the research showed that marble filtration still scored the best due to a high water quality, a considerable CO2 efficiency (85-90%) and low calcium carbonate precipitation. Other than expected, the turbidity precisely in the water produced with marble filtration appeared to be minimum. A tasting panel at the University of Wageningen gave a positive assessment about the taste of the ‘new’ water of Oasen.

Difference in water temperature used


The main difference between the researches by both water companies is the water temperature used. Whereas Oasen works with a relatively constant groundwater temperature of 11° C, Evides is faced with the challenge of also remineralising treated surface water in the winter at a temperature of 2° C. The pilot research with marble filtration at low water temperatures showed that – as a result of a slower reaction kinetics – either a longer contact time or a higher (and therefore less efficient) carbon dioxide dosage is necessary in order to achieve the same water quality objectives as at 11° C (see Illustration 1). This has direct consequences for the dimensioning and the cost factor of the remineralisation process. However, the research results show that this does not result in unrealistic practical situations.

Illustration 1. Efficiency of carbon dioxide usage during remineralisation with marble filtration as a function of the contact time for various carbon dioxide dosages and a water temperature of 2°C.

Final conclusion

As a result of the four-year research programme of Oasen, marble filtration resulted as the best available technique for remineralisation. The robustness, the high CO2 efficiency and the low turbidity and calcium carbonate precipitation were the deciding factors. Evides and Oasen arrived at the same cost factor: approximately 6 to 8 cent per cubic metre of water produced. As a result, marble filtration is also the cheapest. Marble filtration is therefore the preference and will actually be realized in the near future at one of the treatment plants of Oasen.
After extensive research, the researchers at Evides showed that it is also possible to remineralise permeate at very low water temperatures with practically acceptable contact times and carbon dioxide dosages. It is true that the efficiency decreases in relation to the proces at higher water temperatures, but the water quality standards can be realized without this leading to unacceptably high costs. The design parameters for marble filtration fall within the expected values, with realistic filtration rates and filter bed volumes. The calcium carbonate precipitation of the filtrate was also extensively researched and meets the requirements.

Follow-up steps

On the basis of the pilot research, Oasen is currently elaborating the complete design for its new treatment plants. In the TKI project Remineralisatie van RO Permeaat (Remineralisation of RO Permeate), in collaboration with KWR Water Research and Royal HaskoningDHV, Oasen has continued with the research into further optimisation and chemical modelling of marble filtration. Evides is using the results of this research within a wider research into future treatment techniques. At Amsterdam International Water Week 2015, Oasen initiated an international session on the theme of remineralisation. In addition, Evides and Oasen both presented their results at the European Desalination Society conference in Rome in 2016.

Danny van der Veldt
(Royal HaskoningDHV)
Marleen Heidekamp
(Evides Drinkwaterbedrijf)
Harmen van der Laan
(drinkwaterbedrijf Oasen, H3O.nu)

Background picture:
Pilot columns for marble filtration, part of the fully automatic pilot plant.


Summary

Evides Waterbedrijf and Oasen Drinkwater wish to be ahead of future threats for the drinking water quality. For this reason, they carried out research, partly collectively, into the application of remineralisation for producing drinking water with reverse osmosis (RO). Their research questions focused on establishing design parameters, such as contact time and the efficiency of the use of carbon dioxide, and also focussed on the filtration rate in relation to the quality requirements, such as hydrogen carbonate and turbidity. They also considered whether the calcium carbonate precipitation of the water produced meets the requirements.

Both companies found that marble filtration appeared to be the most suitable technique for remineralisation. Oasen will actually realize this technique at one of its treatment plants in the near future. The researchers at Evides showed that it is also possible to remineralise permeate during the winter at very low water temperatures, with practically acceptable contact times and carbon dioxide dosages. Evides is using the results of this research within a wider research into future treatment techniques.


Sources


Coppens L. et al. (2014), Impact van RWZI’s op geneesmiddelconcentraties in kwetsbaar oppervlaktewater (Impact of sewage treatment plants on medicine concentrates in vulnerable surface water) (H2O, 26 November 2014)

Houtman, C.J. et al. (2010) Emerging contaminants in surface waters and their relevance for the production of drinking water in Europe, Journal of Integrative Environmental Sciences, 7:4, 271-295, DOI: 10.1080/1943815X.2010.511648

Hamann, E et al. (2016) The fate of organic micropollutants during long-term/long-distance river bank filtration, Sci Total Environ. 2016 Mar 1;545-546:629-40. doi: 10.1016/j.scitotenv.2015.12.057. Epub 2016 Jan 5.

Ter Maat J. et al. (2015) Cumulatieve effecten van externe ingrepen voor de zoetwatervoorziening in de 21e eeuw (Cumulative effects of external interventions for the fresh water provision in the 21st century), Rapport Deltares, Deltaprogramma, Deelprogramma Zoetwater, June 2015 (http://publications.deltares.nl/1220104_000.pdf)

^ Back to start

REMINERALISATION

Production of drinking water

Knowledge journal / Edition 1 / 2018

The NL fish population scan: monitoring fish populations using an eDNA approach

The Water Framework Directive (WFD) obliges water authorities to carry out periodic monitoring of fish populations. New techniques on the basis of environmental DNA (eDNA) potentially form good and more cost efficient alternatives for the monitoring of the fish species composition. In this article results of a newly developed application ‘The NL Fish Population Scan (NL Vispopulatiescan) are presented.

Water authorities are obliged to monitor fish populations. Conventional fish inventory methods are known to have drawbacks: e.g. species are missing, the techniques are highly labour- and cost intensive and the techniques are rather invasive as it disturbs the fish and destroys the habitat.
New methods focussing on the presence of eDNA (traces) are potentially animal-friendlier, easier to standardize, more reliable and a cheaper alternative for determining the species composition of fish populations.
In 2017, KWR, Water authority Limburg, Water authority Aa en Maas, Water authority Brabantse Delta, ATKB, BaseClear and Witteveen+Bos developed a new eDNA metabarcoding method, the NL Fish Population Scan. The method and the validation of the method in the laboratory was introduced in the 2nd edition of Water Matters 2017 (Wullings et al. 2017). In this follow-up article, the results of the NL Fish Population Scan are compared with conventional fish population samplings in the waterbodies Roer, Dieze, Stadse Aa, and Aa of Weerijs.
An important comment regarding this comparison is that both methods are subject to biases due to catch and detection efficiency and the distribution of fish.

Research set-up

In the summer of 2017, in the Roer, Stadse Aa, Dieze, and Aa of Weerijs eDNA and conventional sampling took place simultaneously at 7, 2, 2 and 5 locations respectively. Both the conventional and eDNA sampling took place along a transect of 250 m. One DNA sample consisted of 10-20 subsamples. Furthermore, a control sample (i.e. no DNA present) for the determination of any possible contamination was included. The conventional sampling was carried out according to the guidelines in the national manual (Handboek Hydrobiologie, Bijkerk, 2014). At one location in the Dieze no fish were caught during conventional WFD sampling. At two locations in the Aa of Weerijs, inadequate DNA could be extracted. These locations were therefore excluded from this study. The available results were merged and compared on the level of the waterbodies.


eDNA and metabarcoding method


The eDNA methodology of the NL Fish Population Scan is based on identifying DNA traces that fish leave behind in the environment. This concerns traces of excrement, slime, skin or scales.


Each fish species is identified on the basis of their unique DNA code. For this purpose, a short mitochondrial DNA fragment from approximately 110 building blocks is selected. This DNA fragment is selectively multiplied (100,000 times), analysed using metabarcoding and matched with a reference database.


Results

The results of the comparison indicated that in three out of four waterbodies (Roer, Stadse Aa and Dieze) more species were detected using eDNA sampling (Figure 1). In the Aa of Weerijs one more specie was detected using conventional sampling.
Both sampling methods overlap in approximately 60% of the species. Differences apply for species which are detected in very low densities (eDNA or kg/h). For instance, in the Aa of Weerijs, the species Eel, Round goby and Cottus rhenanus were found only with eDNA, whereas with conventional sampling only Pike-perch, Asp, Topmouth gudgeon and Ide were detected. These differences can be explained by the sampling location, sample size and the behaviour of species; which all affect the chance of detection.

Figure 1. Number of species detected per investigated body of water

The species that were additionally detected in the eDNA samples correspond with species which could be expected in these types of water systems. For three out of four water systems this concerns species such as Carp, Pike, Prussian carp/Goldfish and Sunbleak (Figure 2). Tench was missed from detection twice. In all these cases, the missed species concerned a low share (<10%) in the total number of eDNA measured sequences. A previous study by Herder & Kranenbarg (2016) using a comparable eDNA metabarcoding approach, confirm our observations. The authors also describe missing observations for species such as Carp, Prussian carp/Goldfish and Sunbleak.
A possible explanation could be that Carp-like species concern adult fish which generally appear in lower densities and are better at escaping from the conventional sampling method.
Sunbleak and Tench are phytophilic (fish which spawn on and live between plants) species which can hide effectively in high strains of vegetation. Other not detected species are only missed in one of the researched systems. Coincidence could also be an important factor in detecting species, as some species only have low DNA densities, and therefor might coexist of a very small population.

Figure 2. Per species, the number of water bodies water (maximum of 4) in which the species has indeed been shown with eDNA, but was not caught in the case of the WFD fish population sampling, and vice versa. Note: Sea lamprey was not in the DNA database and could therefore not be detected with eDNA.

With the eDNA sampling, one or sometimes a few species could not be detected (Figure 2). Usually, this concerned species which were found in relatively low densities (<0.2 kg/ha). In the Aa of Weerijs, this also concerned a relatively large population of Ide (approx. 35 kg/ha) and Pike-perch approx. 10 kg/ha). Ide and Pike-perch accounted for approximately 20 and 12% of the biomass of the populations found (at sampling location). For Pike-perch in particular this concerned large fish. From literature it is known that eDNA densities are lower by large fish.
Despite the high detection sensitivity of the eDNA sampling approach, species may still be missed. For example, in water bodies with low fish densities, low eDNA concentrations can be expected. In such situations sampling needs to take place in the direct proximity of a particular individual in order to obtain eDNA at all. Just as with every sampling method, coincidence plays an important role in the eDNA sampling approach.

Conclusions

The results of the present study show that:

  • The NL Fish population scan is an advanced application that allows quick and effective determination of species composition within fish populations, in both stagnant and flowing waters.

  • The NL Fish population scan gives an important additional overview of the diversity of species present in relation to the conventional fish sampling. With this approach, in three out of four systems, more and additional species were detected which could be expected in these water systems. These results are in line with previous findings by Herder & Kranenbarg, 2016 and are probably the result of the sensitivity of the developed method at which also small amounts of eDNA are detectedDue to this high sensitivity, there is also an additional risk of false-positive observations. This was excluded from this research by using a blank control sample. The current method appears to be more reliable.

  • For unknown reasons the used eDNA extraction method (precipitation in the field with isopropanol) appears to be sensitive to disturbances in some of the sampling locations. At present, work is being carried out on a second extraction method on the basis of lab filtration. The current method looks promising but requires further optimization.

  • Species can also be missed with the NL Fish Population Scan due to (very) low fish densities at which only small amounts of eDNA will be present and catch coincidence. Additional research is required in order to determine whether the reliability of the method will increase in the case of a higher sampling effort.

Future

The deployment of eDNA for the monitoring of fish populations potentially forms a good alternative for determining the species composition. However, in order to make eDNA a full-fledged alternative to the conventional monitoring, a number of development directions are proposed:
1. Comparison of several eDNA metabarcoding methods which are being developed, in order to reach a national or European standard to be applied. This includes for instance the standardization and/or harmonization of sampling, extraction and bioinformatics. National/European attunement and carrying out ring tests and inclusion in the national manual (Handboek Hydrobiologie) appear to be appropriate. NEN certification could also be considered.
2. Adjustment of the WFD metrics for the assessment of the fish population to the possibilities of eDNA. The current WFD assessment takes place on the basis of the species composition and relations between species in numbers and biomasses. An exploratory analysis shows that the information required about numbers and/or biomasses for the current WFD monitoring cannot (yet) be determined sufficiently reliably with eDNA. Due to the added value of the technology and the cost effectiveness, a possible adjustment for the assessment is already being discussed. Depending on the objective, both methods can be deployed parallel to each other.
Financing of this research was partly due to the Premium for Top consortia for Knowledge and Innovation (TKI's) from the Ministry of Economic Affairs (Topsector Water).

Marloes van der Kamp
(Witteveen+Bos)
Marco Beers
(Waterschap Brabantse Delta)
Michiel Hootsmans
(KWR Watercycle Research Institute)
Bart Wullings
(KWR Watercycle Research Institute)

Summary

Water authorities are obliged to monitor the fish population. However, the current conventional fish inventory methods are known to have drawbacks. New methods on the basis of eDNA appear to be a good alternative for determining the species composition of a fish population. In 2017, KWR, Water authority Limburg, Water authority Aa en Maas, Water authority Brabantse Delta, ATKB, BaseClear and Witteveen+Bos developed a new eDNA metabarcoding technique, the NL Fish population scan. The NL Fish population scan was applied in the Roer, Stadse Aa, Dieze and Aa of Weerijs. The results were compared to the results from conventional fish population samplings and show that the NL Fish population scan in the study area gives a good insight in the species composition. With the NL Fish population scan, in almost all cases more species are detected. The species which were found additionally with the NL Fish population scan could be expected in the study area. The NL Fish population scan potentially forms a good alternative for determining the species composition within the current WFD monitoring.


Literature


J.E. Herder & J. Kranenbarg, 2016. eDNA metabarcoding vissen – Verkennend onderzoek naar de mogelijke toepassing van eDNA voor de KRW vismonitoring, RAVON/STOWA rapport 2016-19. (eDNA metabarcoding fishing – Exploratory research into the possible application of eDNA for the WFD fish monitoring, RAVON/STOWA report 2016-19)

B. Wullings, D. van der Pauw Kraan, E. Kardinaal, M. Hootsmans, 2017. Characterising fish populations quickly and efficiently using eDNA metabarcoding. Water Matters 2017-2.

R. Bijkerk (editor), 2014. Handboek Hydrobiologie. Biologisch onderzoek voor de ecologische beoordeling van Nederlandse zoete en brakke oppervlaktewateren. Deels aangepaste versie. Stowa rapport 2014-02. (Hydrobiology Manual. Biological research for the ecological assessment of Dutch fresh and brackish surface waters. Partly amended version. Stowa report 2014-02.)

^ Back to start

FISH POPULATION SCAN

eDNA, a promising approach

Knowledge journal / Edition 1 / 2018

Coastal protection by means of natural mangrove recovery: experiences from Demak

In Demak in Indonesia, mangrove forests are affected at a high rate by aquaculture, urban development, pollution and infrastructure. With the disappearance of mangroves, biodiversity is lost, the fishing industry declines and the coast becomes vulnerable to salinisation, erosion and storm damage. Climate change aggravates the situation. Is it possible to create a win-win situation for mankind and nature by utilizing natural processes in order to recover mangrove coasts?

Demak: from prosperity to disaster

The district of Demak, near the city of Semarang with more than one million inhabitants in Central Java, has been an important rice producer for more than 100 years. Since the coastal area also appeared to be highly suitable for the cultivation of prawns and fish, in the eighties rice farmers transferred en masse to aquaculture. Since that time, the coast has seriously declined: there are barely any protective mangrove forests left between the Java Sea and the endless rows of prawn ponds. Erosion is increasing and the coastline has receded.
Local authorities reacted to the erosion problems with ‘hard measures’ such as mortared dykes, breakwaters made of stone or concrete and river canalisation. Unfortunately, the hard structures subside into the soft ground, they block the inflow of sediments in the tidal zone and they cause scouring on the seaside due to reflection from the waves. As a result, the infrastructures make the erosion worse and limit the possibilities for recovery of the mangroves. Large-scale waterworks may offer proper protection, but have even greater ecological effects and are expensive to set up and maintain. This problem is painfully obvious in Demak but is also a concern along other tropical mud coasts such as in Thailand, Vietnam, Suriname, and Guyana.

Illustration 1. Development of the coastline near Demak 2003-2013

Landscape analysis

A systems approach is vital to devise adequate solutions for these vulnerable coasts. In a consortium with local governments, companies and NGOs, the Ecoshape innovation platform is working towards coastal resilience in Demak. In 2015, a landscape analysis was carried out in order to assess the ecological and hydro-morphological system and the local socio-economic and institutional context. The erosion appears to have various causes:
• the disappearance of mangroves which capture sediment and dampen the waves
• subsidence due to groundwater extraction
• disruption of sediment supply and the dynamics due to river canalisation and the construction of prawn ponds and other infrastructure in the tidal zone.
Unclear and overlapping mandates from government bodies, failure to observe regulations and the limited involvement of the local community in planning were found to obstruct the development of a widespread solution.

Illustration 2. Coastline near Demak, with the permeable dams (coloured) in the sea. The cumulative erosion (negative) and sedimentation (positive) can be seen during the rainy season, modelled with the aid of D-Flow Flexible Mesh (Smit, 2016).

Solutions

Based on this assessment, together with the Indonesian government, the consortium partners developed a Building with Nature approach to protect the coast and to develop the local economy sustainably. Maintenance and recovery of ecosystem services and natural processes are the basis of an integral design. The initiative involves a participatory planning process that is built on three cornerstones:
1. Coastal protection measures: grids of permeable structures made of bamboo and brushwood are constructed along the eroding shoreline in order to capture sediment (comparable to Dutch ‘saltmarsh works’). In this way, a mud substrate accumulates on which mangrove trees can establish themselves spontaneously. In the long term, the recovered mangrove forests take over the protective role of the permeable structures and prevent further coastal erosion. The natural dynamics of the canalised rivers will also be restored to facilitate sediment inputs, improve hydrology and accommodate space for mangroves along the river branches.
2. Socio-economic measures: together with local fish and prawn farmers a sustainable aquaculture regime is being developed. They give up a part of their land on the coastal strip and along rivers in order to make room for mangroves. They receive compensation for this. In their ponds in the hinterland they deploy organic aquaculture techniques. The recovered mangroves protect the ponds against storm damage and boost fisheries, and in the long term enable wood production. The communities receive training and micro-finance to support the transition towards a sustainable mangrove-based economy. They pay their loan back in-kind through their engagement in the restoration and maintenance of the mangrove forest.
3. Planning and government: Long-term sustainability is ensured by incorporating agreements around these measures in bylaws and government plans and by facilitating enforcement of legislation. Upscaling of the measures is facilitated by facilitating community access to existing funding sources for rural development. The system analysis brings together various sectors at provincial level and thereby fosters the development of master plans along the whole North Java coast. Subsequently, project partners help with the alignment of provincial master plans to national policy. In this way, the project serves as a case study which stimulates better collaboration amongst government partners.

First results

After a promising small-scale pilot in 2014, a five-year programme was set up which is now in its third year, and which serves as a basis for further scaling-up in the future.
In phases, more than 5 kilometres of permeable bamboo structures have been built. In addition, the Indonesian government has placed another 11 kilometres of bamboo structures in 12 other districts in North Java. They are working properly; after accumulation of a few tens of centimetres during the first year, they continue to capture sediment and gradually a foreshore is emerging along the coast. However, the dams require a great deal of maintenance, due to damage caused by shipworms among other things. The design is currently being further optimized based on monitoring results.
Unfortunately, the subsidence in the area appears to be worse than was thought. Large-scale water extraction in Demak and the nearby city of Semarang appears to be causing a subsidence in the whole region, amounting locally to more than 10 centimetres per year. This leads to two problems: although the ground behind the dams builds up quickly, the substrate is also subsiding very quickly. As a result, the supply of fresh sediment remains necessary and it is difficult for mangroves to colonise the foreshore. In addition, the subsidence causes large-scale floods and the development of basins in the hinterland which – as long as there is no closed coast – will eventually be permanently under water. To safeguard the future of Demak and the surrounding towns and industry, the groundwater extraction has to decrease. The project has responded to these challenges by stimulating a regional and national dialogue about integral water management, groundwater extraction and subsidence.
The sustainable aquaculture is successful. The transfer to an organic prawn cultivation scheme has resulted in a production increase of 300 percent. Unfortunately, subsidence also has its impact here: as the level of ponds lowers, floods cause more damage to the surrounding dykes. As a result, the water quality decreases and fish and prawns are washed away. For this reason, alternatives are being considered, such as netted aquaculture in the tidal lakes.
The collective planning is working. The system analysis has brought together various parties who now work together on plans for sustainable management of the north coast of Java. The Building with Nature project serves as a flagship which inspires, informs and mobilises people. At national level, an Indonesian innovation platform has been started which charts opportunities for Building with Nature, builds up knowledge and brings together public and private parties in the water sector. In this way, interventions are attuned to each other and opportunities occur for scaling-up the approach.

Building with Nature: opportunities for tropical coasts

Despite the challenges, the tropical application of the ‘saltmarsh works’ offers considerable opportunities for vulnerable mud coasts. Sustainable land use and the recovery of natural capital reduce poverty and can revive the local economy. The system analysis and subsequent multi-sectoral planning process enable the development of integral coastal zone management solutions, based on the best available science. Companies, knowledge institutions, governments and NGOs must learn to find their way within new forms of collaboration.
It is important to implement Building with Nature as a tailor-made approach and adapt project activities as insights into the functioning of the coastal system evolve. This requires a cyclical, phased implementation model and thorough monitoring. Good legislation and enforcement are vital to sustain the measures in the long-term.

Pieter van Eijk
(Wetlands International)
Fokko van der Goot
(Ecoshape)
Susanna Tol
(Wetlands International)
Bregje van Wesenbeeck
(Deltares)
Tom Wilms
(Witteveen+Bos)

Background picture:
Coastal work near Demak: the local population is also working on the construction of the permeable dams (photo: BOSKALIS)


More information

For more information about the project and the collaboration between the Consortium partners Ecoshape, Wetlands International, the Indonesian ministries of Marine Affairs and Fisheries and Public Works, Deltares, Witteveen+Bos, Wageningen University, UNESCO-IHE, Blue Forests, Von Lieberman, Diponegoro University, and the local population, visit: www.indonesia.buildingwithnature.nl. The programme is financed by the Dutch Ministry of Foreign Affairs from the FDW (Sustainable Water Fund programme), and by BMUB (German Federal Ministry for the Environment, Nature Conservation, Building and Nuclear Safety) from the International Climate Initiative.

Brochure Building with Nature: reaching scale for Coastal resilience Design and Engineering plan Building with Nature Indonesia

Building with Nature Indonesia – Meet the partners

Summary

The first results and experiences from a Building with Nature programme along the seriously eroding mangrove coast in North Java show that combining infrastructure, environmental restoration and sustainable land-use measures offers major opportunities for coastal resilience, for economic development and for nature.

This requires stakeholders from multiple sectors to work together, on the basis of a shared understanding of the coastal system. Rather than implementing a static engineered design, they need to work together in an adaptive planning process that encompasses a range of interventions. Integrating this approach in policies, governance frameworks and budget allocations ensures long-term sustainability and offers of substantial opportunities for upscaling of Building with Nature across the region.


References


Wesenbeeck, B.K. van, Balke T., Eijk P. van Tonneijck, F. Siry, H.Y., Rudianto, M.E. & Winterwerp J.C., 2015. Aquaculture induced erosion of tropical coastlines throws coastal communities back into poverty. Ocean & Coastal Management 116, pp. 466-469.

Spalding, M., McIvor, A. Tonneijck, F. Tol, S. & van Eijk,. P., 2014. Mangroves for coastal defense. Guidelines for coastal managers and policy makers. Wetlands International and The Nature Conservancy. 42 p.

Winterwerp, J. C., Erftemeijer, P.L.A. Suryadiputra, I.N.N. van Eijk, P. & Zhang, L., 2013. Defining Eco-morphodynamic Requirements for Rehabilitating Eroding Mangrove-Mud Coasts. Wetlands.

Smits, B.P., 2016. Morphodynamic optimisation study of the design of semi-permeable dams for rehabilitation of a mangrove-mud coast. Delft University, Delft.

^ Back to start

MANGROVE RECOVERY

Experiences from Demak

Knowledge journal / Edition 1 / 2018

Powdered activated carbon dosing in activated sludge in order to remove micro-pollutants

Water pollution with substances such as medicine remains, industrial pollution and pesticides is a growing problem. With their effluent, sewage water treatment plants contribute to the emission of these micro-pollutants. One of the options to decrease these emissions is the adsorption to activated carbon. The project ‘Schone Maaswaterketen’ researched the addition of powdered activated carbon to the activated sludge of a wwtp (wastewater water treatment plant), in order to find out whether this is an effective and affordable manner of making the effluent cleaner.

This article describes the research into the full-scale application of a continuous dosing of powdered activated carbon (PAC) in the activated sludge of the wwtp Papendrecht. This research took place within the project ‘Schone Maaswaterketen’ (SMWK), a collaboration between the four drinking water companies and five water authorities along the Maas, the Hoogheemraadschap van Delfland, Waternet, STOWA, the Department of Public Works and the Ministry of Infrastructure and Water Management.
In the River Maas, the pollution with micro-pollutants is also increasing. The Maas is a rain river and during times of drought the discharge consists mainly of wwtp effluent, while the Maas is also a source for drinking water treatment. For this reason, the parties affiliated with SMWK collectively carried out research into the application of powdered activated carbon as a relatively simple technique for improving existing wwtp’s with regard to removing micro-pollutants. This research is called the PACAS project (Powdered Activated Carbon in Activated Sludge). The central objective was: establishing the effectiveness and efficiency of the direct dosing of powdered activated carbon to activated sludge, for the extensive removal of micro-pollutants from wastewater. This article is a detailed summary of the PACAS research, which was described in a recently published STOWA report (STOWA 2018-02).

Activated carbon in water treatment

For drinking water treatment, activated carbon has already been applied for some time for the removal of micro-pollutants. Use is made of activated carbon in grain form and in powder form. The grain carbon (granular activated carbon, GAC) is used as a (biological) filtration step, where particle sizes up to a few millimetres are applied. The application of powdered activated carbon takes place in contact tanks with downstream filtration in order to capture the powdered activated carbon again after use.
At wwtp’s, the application of powdered activated carbon meanwhile has two forms: adding a dosage to wwtp effluent in a contact tank, with subsequently a coagulation step and filtration step, as well as the addition of a dose to the activated sludge. In this research, the latter variant was used: adding a dose of powdered activated carbon (PAC) to activated sludge, so into the standard treatment process. The dry powdered activated carbon is first dissolved in water and then added as slurry into the activated sludge system. The activated carbon is collected in the activated sludge flocs. With this method, fresh activated carbon is continually introduced into the system. Once the adsorption has taken place, the sludge including the loaded activated carbon is removed and processed in the usual manner.

Illustration 1. Layout of wwtp Papendrecht. RGV grease trap; SEL: selector; ANT: anaerobic tank; AT: activated sludge tank; NBT: sedimentation tank; SOI: sludge dewatering plant; BDG: industrial building (Source: Google Maps).

Full-scale research at the wwtp Papendrecht

During a period of twelve months (July 2016-June 2017), powdered activated carbon was dosed into a wwtp representative for the Netherlands, with two parallel lines: the wwtp Papendrecht (see illustration 1). One of the two lines was provided with a powdered activated carbon dosage (the PAC line) and the other served as a reference line.
Wwtp Papendrecht was chosen as a pilot location after a screening of wwtp’s of the partners of the ‘Schone Maaswaterketen’. The pilot location had to meet the following criteria, among other things:
• the wwtp has a treatment system representative for the Netherlands with an activated sludge system and sedimentation and customary effluent requirements for nitrogen and phosphorus;
• the wwtp is equipped with (at least) two identical separated treatment lines;
• the wwtp is loaded as normal at 70-90% of its design capacity;
• the wwtp offers sufficient sedimentation capacity in order to process a possible increase in the dry matter content of the sludge;
• there is interest in the research and there is commitment from both the operational organization and the management.
From a shortlist of five possible locations, the wwtp Papendrecht of water authority Rivierenland best met the criteria mentioned above. The conditions at wwtp Papendrecht appeared to offer an excellent opportunity for researching the effects of PAC on removing micro-pollutants and for making a comparison between both lines. The wwtp has its own sludge dewatering facilities, where activated sludge is thickened and dewatered in turn from two activated sludge tanks. In this way, the effect of powdered activated carbon on the dewatering properties could be monitored.
With a sludge load of approximately 0.040 kg BZV/kg DS.day, wwtp Papendrecht is an average wwtp for Dutch benchmarks. In addition, the type of treatment with biological phosphorus removal is typical of an average Dutch wastewater treatment plant. The wwtp Papendrecht has a design capacity of 48,000 pe (population equivalent) (at 150 g TZV/d). During the past few years, the load of the wwtp was between 70 and 80% of the design capacity.

Micro-pollutants

The term ‘micro-pollutants’ is a collective name for a large number of organic compounds which are found in very low concentrations (ng/l to µg/l) in (treated) wastewater and surface water. This includes human and veterinary medicine remains, as well as for instance personal care products, fire retardants, plasticizers and pesticides. In this study, 51 substances were analysed:
1. medicine remains and radiographic contrast media (26 substances)
2. industrial pollution and consumer products (9 substances)
3. pesticides (16 substances)
Before the start of the research, a check was carried out whether the micro-pollutants to be analyzed were present in the influent and effluent in measurable concentrations.

Dosing unit and selection of powdered activated carbon

The dosing unit was built into a 10-foot sea container, with the PAC storage tank on top. In this research, use was made of activated carbon from the company Calgon Carbon, the Pulsorb WP 235 (after a careful selection, see the STOWA report). The activated carbon is transported from the storage tank and stored and weighed in an interim buffer, then using a screw conveyor the activated carbon is dosed into a vortex mixer, where it is mixed with clean water, and further transported to the activated sludge tank. During the first dosing period of ten weeks, the interval between changing the tanks was approximately 14 days, for the highest dosage ratio the interval was approximately 6 days.

Illustration 2. Arithmetic average and dispersion of all the measured removal efficiencies of micro-pollutants, per dosing period

Removal efficiency

In four periods of each approximately 10 weeks, 10, 15, 20 and 25 mg of powdered activated carbon per litre of influent were dosed successively. Influent and both effluents were continually sampled at a proportional flow rate, then multi-day mixed samples from subsequent days were composed. A minimum sampling duration of 48 hours was deployed. The lowest dose (10 mg PAC/l) already gives on average a substantial increase in the removal yield, see Illustration 2. The removal yield of micro-pollutants increases from 40% (in the reference line) to 80% with a powdered activated carbon dose of 25 mg/l (see also Illustration 2).

Ecotoxicity

In order to gain an impression of the ecotoxicological effects of removing micro-pollutants, samples were also collected for this purpose during the dosage periods of 15, 20 and 25 mg PAC/l. The results of effect measurements with 14 bioassays were assessed according to the Simoni methodology, see STOWA 2016-15A. From this, it appeared that the dosing of powdered activated carbon considerably reduced the toxicity, expressed in the Simoni score. For the details, see the STOWA report mentioned of the PACAS project.

Costs and technical integration

With regard to costs, at present the dosing of powdered activated carbon is the cheapest option for lowering concentrations of micro-pollutants in wwtp effluent. Cost calculations were made for two wwtp capacities and four PAC doses. For a powdered activated carbon dose of 15 mg/l, the total costs are 3.5 to 6 eurocent per cubic metre of treated effluent. The technical integration of a powdered activated carbon dosing is simple and requires little storage space. For the realization, no irreversible adjustments need to be made to the process parts at the wwtp. As a result, the dosing of powdered activated carbon can be easily stopped (temporarily) or moved to another wwtp.

Conclusion

With the results of the PACAS research, an attractive alternative has been added to the available technologies for removing micro-pollutants from sewage. In principle, the dosing of powdered activated carbon can be applied to all wwtp’s with activated sludge, in any case insofar as they are not fully loaded. The PACAS technology is an interesting ‘no regret’ measure for wwtp’s where removal of micro-pollutants is desired. The application of this technique offers the possibility of reducing the amounts of micro-pollutants in wwtp effluent relatively cheaply.

Herman Evenblij
(Royal HaskoningDHV)
Paul Roeleveld
(Royal HaskoningDHV)
Katarzyna Kujawa-Roeleveld
(LeAF)
Els Schuman
(LeAF)
Ad de Man
(Waterschapsbedrijf Limburg, subsidiary of Limburg water authority)
Mirabella Mulder
(Mirabella Mulder Waste Water Management)


Background picture:
Interior of dosing unit


Summary

Pollution of surface water with micro-pollutants, for instance medicine remains and pesticides, is a growing problem. The effluent of sewage treatment plants also contains micro-pollutants. One of the options in order to lower these emissions is to lower the adsorption of activated carbon. Research at rwzi Papendrecht has taught that the addition of powdered activated carbon (PAC) to the activated sludge is an effective, relatively simple and cheap way to remove micro-pollutants. The ecotoxicity of the effluent decreased considerably, and with regard to costs, the dosing of powdered activated carbon appeared to be the cheapest option for lowering concentrations of micro-pollutants in rwzi effluent.


References


STOWA, 2016-15A Ecologische sleutelfactor toxiciteit, deel 1 Methode voor het in beeld brengen van de effecten van giftige stoffen in oppervlaktewater (Ecological key factor of toxicity, part 1 Method for charting the effects of toxic substances in surface water).

STOWA, 2018-02 PACAS – Poederkooldosering in actiefslib voor de verwijdering van microverontreinigingen (Powdered activated carbon dosing in activated sludge for the removal of micro-pollutants).

^ Back to start

ACTIVATED CARBON DOSING

To remove micro-pollutants

Knowledge journal / Edition 1 / 2018

Effect of Calcium and Bicarbonate on Iron Removal During Groundwater Treatment

Groundwater is a major source of drinking water in The Netherlands. At centralized water treatment plants (WTPs) it is typically treated by aeration and one- or two-step rapid sand filtration. During aeration oxygen is introduced to the anaerobic groundwater to oxidize indigenous ferrous [Fe(II)] to ferric [Fe(III)].


The formed Fe(III) reacts with water to form reddish-brown Fe(III) (oxyhydr)oxide particles, hereby referred to as Fe(III)-precipitates. The Fe(III)-precipitates are separated from water during rapid sand filtration and the filtrate is pumped into the distribution network after storage. Although the Directive 98/83/EC limits the maximum iron concentration in drinking water at 200 µg/L (Council, 1998), the drinking water companies usually target removal of iron to much lower levels for the anticipated lower network maintenance costs and customer satisfaction. For instance, Brabant Water, a major public water supply company in the Netherlands, targets removal of iron to <20 µg/L before supply.


New studies

In general aeration—rapid sand filtration systems are operated by drinking water treatment companies based mostly on experience and rules of thumb [1]. Studies are ongoing to gain specific insights and to model the removal of iron during rapid sand filtration. For example, within the joint research programme of the Dutch drinking water companies (BTO) a knowledge based model is under development which will facilitate process optimization and advanced control of filter operation [2]. pH is widely regarded as a major parameter that determines the iron removal efficiency in aeration—filtration systems [3, 4] because the oxidation rate of Fe(II) increases with increasing pH in the range of most groundwater streams [5]. However, the ionic composition of water may also strongly affect iron removal, especially during the flocculation phase [6]. Regrettably, not much attention is being paid to the ionic composition in modeling and optimizing the conventional iron removal processes. In this paper we present a pilot study carried out at WTP Eindhoven in The Netherlands (BOX 1) to understand the important role of calcium (Ca) and bicarbonate (HCO3) in iron removal during aeration—rapid sand filtration.
Water treatment plant Eindhoven is the largest groundwater water treatment plant of Brabant Water, producing 20 Mm3/year drinking water. The produced drinking water is of high quality. The current treatment scheme comprises tower aeration, pre-rapid sand filtration, lime and potassium permanganate dosing in pre-filtrate and post-rapid sand filtration. In 2018 the treatment facility will have to be renovated and currently the process technology department of Brabant Water is investigating options to optimize the treatment design.

Pilot setup and feed water quality

A pilot plant including a tower aerator and a filter column was installed at WTP Eindhoven. The filter column (surface area 0.8 m2) was filled up to 1.5 m with sand (0.5-0.8 mm) at the bottom and 0.5 m anthracite (1.0-1.6 mm) at the top. The pilot filter was operated at 5 m/h filtration velocity. Two types of feed streams were used in the study. Both feeds mainly differed in pH and concentrations of Ca and HCO3, as shown in Table 1.

Iron removal as function of feed water quality

Figure 1 presents the filtrate turbidity as a function of feed water quality. Here the particles that cause turbidity are Fe(III)-precipitates. It can be seen that the filtrate turbidity decreased dramatically from an average of 0.5 NTU to an average of 0.1 NTU with the change from feed 2 to feed 1. Feed 1 showed significantly higher electrical conductivity, as evident in Figure 2, which can be ascribed to the higher Ca and HCO3 concentrations in feed 1 (Table 1). HCO3 is known to provide buffer capacity to avoid excess pH drop upon Fe(II) oxidation [7] and therefore its higher concentration may explain the higher total iron removal in case of feed 1. Calcium, on the other hand, can affect the surface charge (zeta-potential) of Fe(III)-precipitates and promote flocculation [8-10] e.g. by charge neutralization. Thus, the higher iron removal and (therefore) lower filtrate turbidity in case of feed 1 may be attributed to its higher HCO3 or Ca concentration or to both.
In order to better understand this a set of additional aeration—filtration experiments was performed, using feed 2. Feed 2 was spiked with different amounts of HCO3 (dosed as NaHCO3, to have a minimal effect on pH) and Ca (dosed as CaCl2) and the treatment performance was monitored. The sults are described in the following sections.

Table 1 Quality of feed streams.

Figure 1: Filtrate turbidity as function of feed water type. Arrow marks the point of change from feed 2 to feed 1.

Effect of bicarbonate

Figure 2 presents the results of the treatment performance at different HCO3 concentrations. We observed that the concentration of dissolved iron in the supernatant decreased with the increase in HCO3 dose, and that the total iron removal efficiency of the aeration—rapid sand filtration pilot improved with increase in HCO3 dose. Thus, presence of a higher HCO3 concentration in water improved iron removal. This is also reflected in Figure 2 which shows that the filtrate turbidity decreased with incremental HCO3 dosing. Interestingly, the filtrate turbidity and iron concentration were not lowered to <0.15 NTU and 20 µg/L (Brabant Water standards) at 35 mg/L HCO3 dose. This HCO3 dose increased the HCO3 concentration of feed 2 to a level comparable to the one in feed 1 (Table 1).

Figure 2 Filtrate turbidity and electrical conductivity as function of HCO3 dose in feed 2 during aeration-filtration experiment.

Effect of calcium


Figure 3 presents the filtrate turbidity and electrical conductivity as a function of Ca dose in feed 2. The filtrate turbidity decreased with incremental dosing of Ca. This confirms that Ca has a positive impact on iron removal from water [8-10]. This result suggests that the higher Ca content of feed 1 might have neutralized or nearly neutralized [10, 11] the charge on Fe(III) precipitate, improving flocculation and resulting in a higher iron removal efficiency in the aeration—filtration system. We also performed a similar experiment with magnesium (Mg) dosing and found similar improvement in iron removal. The Ca dosing of 13 mg/L increased the total Ca concentration of feed 2 to a level that was comparable to the one in feed 1 (Table 1). Interestingly, the filtrate turbidity with Ca dosing of 13 mg/L is similar to the results obtained when the aeration—filtration experiments were performed with feed 1 (Figure 1).

Figure 3 Filtrate turbidity and electrical conductivity as function of Ca dose in feed 2 during aeration-filtration experiment.

Conclusion and outlook

We have shown that the major groundwater ions HCO3 and Ca have a profound impact on the filterability of iron in rapid sand filters. Higher concentrations of these ions in raw water may lead to better removal of iron in rapid sand filters. These new insights have been extremely helpful in optimizing iron removal at several treatment plants of Brabant Water. Based on the findings reported in this paper, an alternative treatment scheme for water treatment plant Eindhoven has been proposed. The alternative scheme includes caustic soda (NaOH) dosing in the raw water to raise the HCO3 concentration, tower aeration and single step rapid sand filtration. The alternative treatment scheme at Eindhoven is expected to reduce chemical use and maintenance costs besides improving water quality.
The specific role of Ca and HCO3 during Fe removal in classic rapid sand filtration should be studied further to gain mechanistic insights.

Acknowledgement

The continuous support from Tim van Dijk (Brabant Water) and Jozef van den Eerenbeemt (Brabant Water) during the study is acknowledged by the authors.

Arslan Ahmad
(KWR Water Cycle Research Institute)
Stephan van de Wetering
(Brabant Water)

Summary

This research is focused on the influence of calcium and bicarbonate on the filterability of iron particles during rapid sand filtration. Pilot tests at Water Treatment Plant Eindhoven show that dosing calcium and bicarbonate can improve iron removal during rapid sand filtration. Further research should focus on the understanding of the involved fundamental physicochemical mechanisms. With the help of this study an alternative treatment scheme for Water Treatment Plant Eindhoven has been developed which makes use of caustic soda dosage to increase the bicarbonate content of raw water. Applying this knowledge to other treatment plants at Brabant Water has already led to successful optimizations of iron removal.


References


[1] P. Mouchet, From conventional to biological removal of iron and manganese in France, AWWA, 84 (1992) 158-167.

[2] D. Vries, C. Bertelkamp, F. Schoonenberg Kegel, B. Hofs, J. Dusseldorp, J.H. Bruins, W. de Vet, B. van den Akker, Iron and manganese removal: Recent advances in modelling treatment efficiency by rapid sand filtration, Water Research, 109 (2017) 35-45.

[3] C.G.E.M. van Beek, J. Dusseldorp, K. Joris, K. Huysman, H. Leijssen, F. Schoonenberg Kegel, W.W.J.M. de Vet, S. van de Wetering, B. Hofs, Contributions of homogeneous, heterogeneous and biological iron(II) oxidation in aeration and rapid sand filtration (RSF) in field sites, Journal of Water Supply: Research and Technology—AQUA, 65 (2016) 195-207.

[4] C.G.E.M. Van Beek, T. Hiemstra, B. Hofs, M.M. Bederlof, J.A.M. van Paassen, G.K. Reijnen, Homogeneous, heterogeneous and biological oxidation of iron(II) in rapid sand filtration, Journal of Water Supply: Research and Technology—AQUA, 61 (2012) 1-2012.

[5] B. Morgan, O. Lahav, The effect of pH on the kinetics of spontaneous Fe(II) oxidation by O2 in aqueous solution – basic principles and a simple heuristic description, Chemosphere, 68 (2007) 2080-2084.

[6] X. Guan, H. Dong, J. Ma, L. Jiang, Removal of arsenic from water: Effects of competing anions on As(III) removal in KMnO4–Fe(II) process, Water Research, 43 (2009) 3891-3899.

[7] Stumm, J.J. Morgan, Aquatic Chemistry: Chemical Equilibria and Rates in Natural Waters, John Wiley & Sons, Incorporated, 2013.

[8] X. Guan, J. Ma, H. Dong, L. Jiang, Removal of arsenic from water: Effect of calcium ions on As(III) removal in the KMnO4–Fe(II) process, Water Research, 43 (2009) 5119-5128.

[9] R. Liu, X. Li, S. Xia, Y. Yang, R. Wu, G. Li, Calcium-Enhanced Ferric Hydroxide Co-Precipitation of Arsenic in the Presence of Silicate, Water Environment Research, 79 (2007) 2260-2264.

[10] C.C. Davis, M. Edwards, Role of Calcium in the Coagulation of NOM with Ferric Chloride, Environ. Sci. Technol., 51 (2017) 11652-11659.

[11] M.M. Benjamin, D.F. Lawler, Water Quality Engineering: Physical/Chemical Treatment Processes, John Wiley & Sons, New Jersey and Canada, 2013.

^ Back to start

IRON REMOVAL

Effect of Calcium and Bicarbonate

Knowledge journal / Edition 1 / 2018

Monitoring for a spatial targeting approach for nutrients

The Dutch government wishes to resolve nutrient problems with region specific mitigation actions. However, without insight into the hotspots and hot moments of nutrient losses such a spatial targeted approach is unlikely to succeed. Region specific mitigation also requires region specific monitoring. Detailed measurements in space and time have an added value.

During the past thirty years, the water quality in agricultural areas has improved, but still not enough to meet the goals for the Nitrates Directive and the Water Framework Directive. The government makes a case for a spatial targeting approach for resolving the nutrient problem. However, such a region specific approach also requires region specific monitoring.
Within the standard monitoring networks for surface water quality, measurements are taken on a monthly basis at downstream locations where nutrients from a large catchment come together. On the basis of those monitoring data, it is generally not possible to univocally establish the sources of the nutrients. Without a clear image of the hotspots and hot moments of nutrient losses, it is not possible to take focused and effective measures.
The aim of this research is to explore the possibilities for supporting an a spatial targeting approach for nutrients with new monitoring strategies. On the basis of various measurement campaigns, we show the added value of detailed measurements in space and time for raising awareness, for law enforcement and for defining frameworks for action.

Methods

We use measuring campaigns in the Hupselse beek (Gelderland), the Lage Vaart (Flevoland), the Elsener beek (Overijssel), the Groote Molenbeek (Limburg), the Salto A (Seeland, Denmark) and the Grote Heideloop (Antwerp, Belgium). There have already been publications about the measurements in the Hupselse beek and in the Lage Vaart in the theses of Rozemeijer (2010) and Van der Grift (2017).
For more insight into sources, routes and biochemical processes, the temporal and spatial variations in surface water nutrient concentrations were measured by continuous monitoring and routings, respectively. For continuous water quality measurements, sensors are needed which remain stable under all field conditions and do not need maintenance too frequently. The continuous phosphorus measurements (P-total and PO4) were taken with the Phospax Sigma auto-analyser by Hach. The continuous nitrate measurements were taken with the Nitratax UV sensor by Hach.
For routings, it is important to be able to measure quickly and at many places. For the nitrate routings in this study, use was made of the Nitrate app by Deltares. In Flanders, nitrate concentrations were measured with a portable reflectometer RQ flex 10 and accompanying test strips (Reflectoquant ® by Merck). Supplementary to this, in the autumn nitrate residue measurements of agricultural fields were taken up to a depth of 90 cm.

RESULTS

Variations in time

Continuous water quality measurements unlock a wealth of information which remains hidden in the case of standard monthly measurements. For instance, high-frequency measurements of P-total in the Hupselse beek (Figure 1a) show that concentrations during flow peaks can increase by a factor 100. The peaks are mainly caused by the supply of phosphate-rich sediment, which builds up during dry periods in the catchment as a result of the bonding of phosphate and iron oxides and hydroxides, being washed away. Overland flow also sometimes plays a role; continuous EC and Ca measurements at the same location show that during flow peaks up to 67% of the discharge consists of fresh precipitation water.

In the Lage Vaart, mainly the difference in hydrology ensures a completely different dynamics in continuously measured P-total concentrations. The measurements were taken at the pumping station De Blocq van Kuffeler, where water is pumped from a mainly agricultural cachment into the Markermeer Lake. When the pumps are switched on, the P-total concentrations become approximately twice as high. The concentration peaks are far less high than in the Hupselse beek, but the summer concentrations in the Lage Vaart are much higher (0.6 mg/l vs. 0.05 mg/l). In polder systems with low flow rates, the phosphate-rich sediment does not reach the pumping station for a large part. The phosphate binds to iron or iron(hydr)oxides and is temporarily stored in the sediments. During dry and warm periods in summer with oxygen depletion in the sediments, this phosphorus is released to the water column again.
In addition, the dynamics in continuously measured nitrate concentrations give an insight into the transport processes. Figure 1c shows that the nitrate concentrations in the Lage Vaart increase in the autumn, at the same time that the subsurface tube drains in the area become active again. As a result of cracks in the clay soil, nitrate can quickly reach the drains via preferential flow through these cracks. This fast transport route typically results in a concentration peak at the pumping station 5 days after a rain shower. The variations in nitrate concentrations in the Lage Vaart are generally easy to predict on the basis of precipitation data (see the time series models in Figure 1c). During a period of frost in January, the concentrations are lower than expected; the precipitation in the form of snow does not lead to drainage. At the end of February, the nitrate concentrations are considerably higher than expected. These high nitrate peaks are the result of the large scale manure spreading in cold and wet conditions, just after the end of the winter ban on manure spreading.

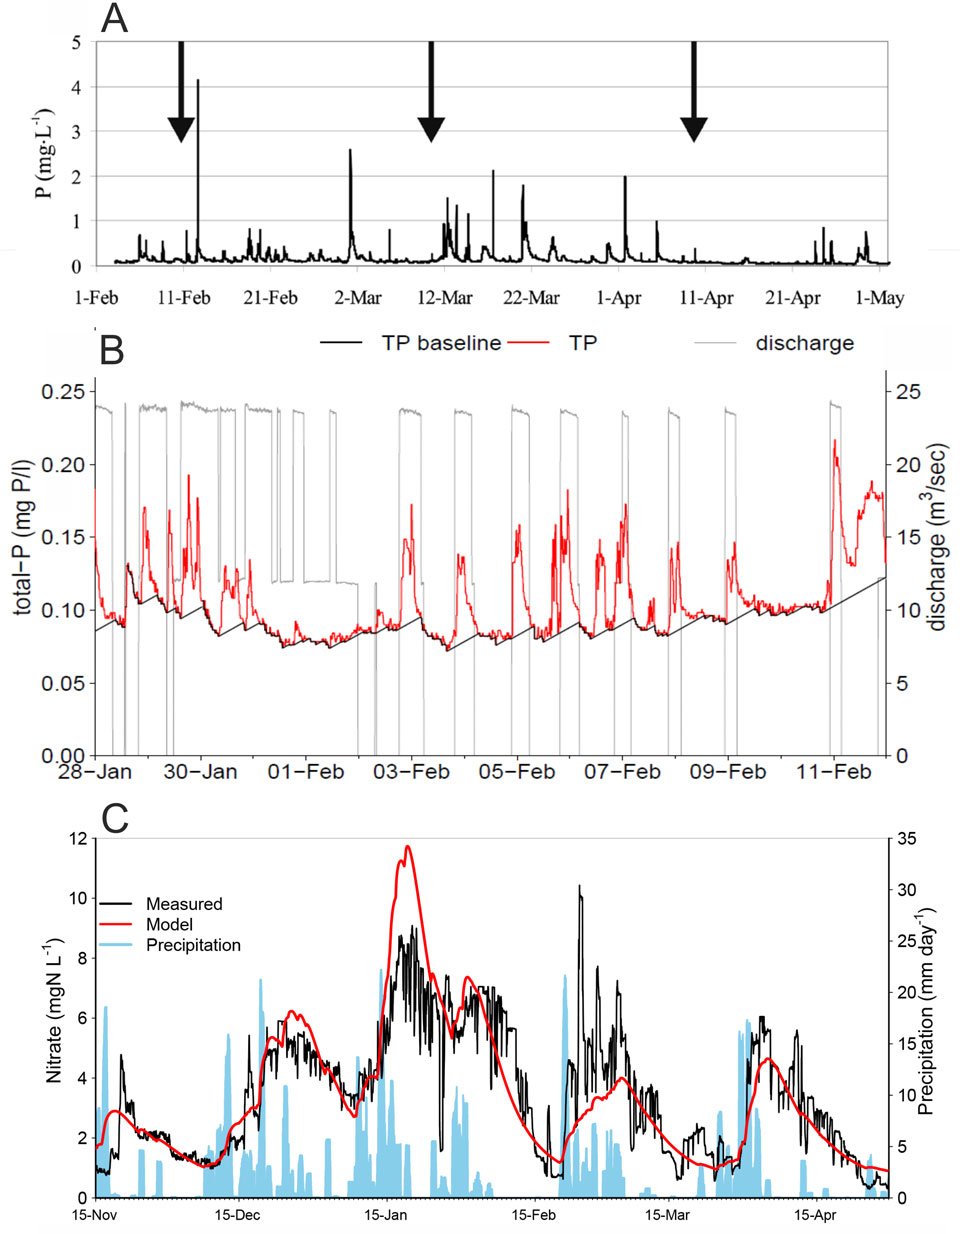
Figure 1. Temporal variations in nutrient concentrations; A: Continuously measured P-total concentrations in the Hupselse beek (the arrows illustrate a monthly sampling scheme); B: continuously measured P-total concentrations and discharge at pumping station De Blocq van Kuffeler; C: continuously measured nitrate concentrations at pumping station De Blocq van Kuffeler (Flevoland), the time series model prediction of the nitrate concentration is shown in red.

Variations in space

The detailed measuring of concentrations in the headwaters of catchments can give a good picture of hotspots of nutrient leaching. Figure 2a gives an example of a nitrate routing in the Elsenerbeek on 14 February 2017. The ditch with high nitrate concentrations (red/orange points on the map) drains two farms where high nitrate leaching occurs.
Via routings, nutrient inputs from unknown spills can also be detecteded. Figure 2b shows for instance detailed measurements where, in a spill into the Groote Molenbeek from a greenhouse, concentrations above 200 mg/l NO3-N were found. A routing can also provide information about the route of nutrients to the surface water. Figure 2c gives the result of a measuring campaign on 19 April 2017 in the Salto A in Denmark. Within 3 hours, it was determined there that the drains were the main route for nitrate.
Similar examples can also be found in Flanders. Figure 3 show nitrate measurements from 16 February 2017 in the arable farming region Grote Heideloop (Province of Antwerp). The concentrations vary from 5 mg NO3/L to 228 mg NO3/L. On the basis of concentration measurements in ditches, it cannot always be determined which agricultural fields have the most influence. For this reason, in autumn 2016 nitrate residues were also measured in risk crops and they varied from 26 to 320 kg N/ha (see Figure 3). The results can be related to not always efficient fertilization practices in combination with the differences in nitrogen uptake efficiencies between crops.

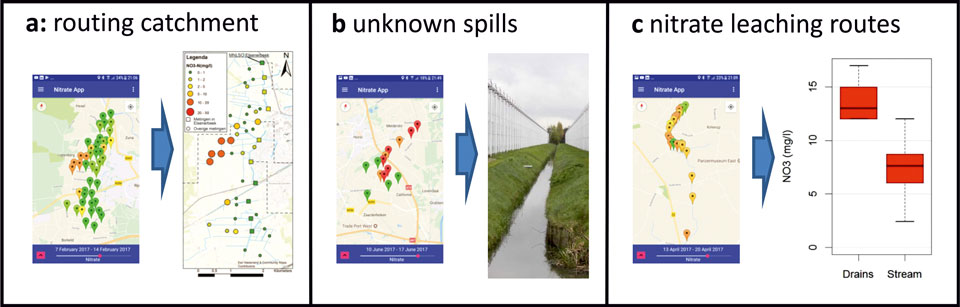
Figure 2. Examples of detailed measurements in catchments: a: routing in the Elsener beek catchment; b: localising unknown spills at Horst (Limburg); c: concentrations in tube drain effluent versus concentrations in the brook (Salto A) at Slagelse, Denmark.

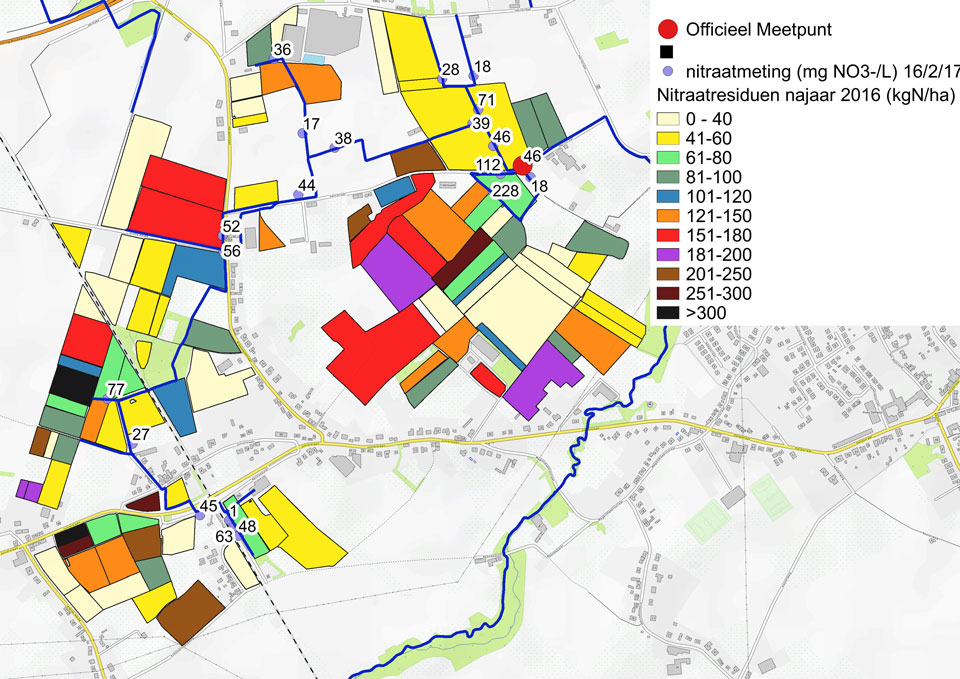
Figure 3. Example of the Flemish approach; detailed measurements in the Grote Heideloop of nitrate concentrations in surface water (figures on the map) in combination with measurements of nitrate residues in agricultural soils (coloured legend).

Discussion

The purpose of this article was to deal with the possibilities for support of an area-focused approach to nutrients with new monitoring strategies. Continuous measurements make it possible to detect incidental peak loads (hot moments) and to quantify the influence of sources, routes and biochemical processes. With routings, hotspots of nutrient losses can be charted and the contributions from various leaching and drainage routes can be quantified. With these area-focused measuring strategies, an interpretation can be given to measuring for raising awareness, for law enforcement and for defining a framework for action.

Measuring for raising awareness

Farmers cannot see where and when nutrients leak from their land. As a result of insight into the concentrations on their own land, the willingness to think of measures along with water authorities is expected to increase. With routings by the water authority, possibly supplemented by measurements by farmers or volunteers, concentrations in the small headwaters of catchments can be depicted.

Measuring for law enforcement

Continuous monitoring and carrying out routings gives supportive information for enforcing bodies. With routings, enforcing bodies can trace locations where many nutrients leach. Continuous measuring systems can give warning signals for unexpected high concentrations that form a reason for inspection and further measurements in the area.

Measuring for a framework of action

In order to find out what water quality measurements are effective, a good picture of sources, routes and processes is necessary. Routings and continuous measurements often provide a great deal of information in this area. If continuous measurements show that the large-scale first fertilization in February leads to the large quantities of nutrients in the water (Figure 1c), then the best option is to invest in storage capacity for manure. If routings show that a few fields contribute the most nitrate (Figure 2a), a wet buffer strip and/or a denitrification reactor could be the most cost-effective measure.

Conclusion

In various projects, it was examined how innovative measuring technology and smart measuring strategies can help a spatial targeting approach for realizing the goals of the Nitrate Directive and the Water Framework Directive. On the basis of continuous measurements, at various locations it was established when and via which routes nutrients end up in the surface water. From water quality measurements in the headwaters of Dutch and Belgian agricultural regions, it appears how considerable the spatial differences in nitrate concentrations can be. In many catchments, a few hotspots can be the cause of too high nutrient concentrations and the water quality objectives can be achieved with a very focused approach. The extra measuring costs can be expected to be more than earned back, because there will be less expenses for measures in the wrong places.

Joachim Rozemeijer
(Deltares, afdeling bodem- en grondwaterkwaliteit (soil and groundwater quality department))
Bas van der Grift
(Deltares, afdeling bodem- en grondwaterkwaliteit (soil and groundwater quality department))
Joris de Nies
(Coördinatiecentrum Voorlichting en Begeleiding Duurzame Bemesting (Information and Support Sustainable Fertilization Coordination Centre, Flanders))

Summary

The government wishes to resolve the problems with too high concentrations of nutrients in agricultural regions with region specific mitigation actions. Without detailed monitoring in space and time, such a spatial targeting approach is unlikely to succeed. Without a clear picture of the hotspots and hot moments of nutrient losses, it is not possible to take focused and effective measures. This article presents examples from the Netherlands and Flanders in which measurements of temporal variations in nutrient concentrations (continuous monitoring) and spatial variations (routings) were carried out. These measurements provide much direct information about sources, routes and processes and help in choosing the right measures at the right spot.


References


Rozemeijer, J.C., 2010. Dynamics in groundwater and surface water quality. Thesis, University of Utrecht.

Van der Grift, B., 2017. Geochemical and hydrodynamic phosphorus retention mechanisms in lowland catchments. Thesis, University of Utrecht.

D’Haene, K., Salomez, J., Verhaeghe M. , Van de Sande, T., De Nies, J. , De Neve, S., Hofman, G., 2018. Can optimum yield and quality of vegetables be reconciled with low residual soil mineral nitrogen at harvest? Scientia Horticulturae 233 (2018) 78–89.

^ Back to start

NUTRIENTS

Targeting approach

Knowledge journal / Edition 1 / 2018

The Mekong Delta is threatening to drown due to the pumping of groundwater

The Mekong Delta in Vietnam is one of the largest deltas in the world. The population has grown considerably, and so have agriculture and industry. In order to provide for the water needs, during the past 20 years groundwater extraction has quadrupled. This leads to problems: groundwater levels have fallen by many metres (up to as much as 20 metres) and the ground has subsided by approximately 18 centimetres. If the subsidence continues, this will unavoidably lead to floods. In order to further understand this process and to be able to direct it in the future, the knowledge available about soils and groundwater in the delta was used to develop a simulation model.

The Mekong Delta, mainly located in Vietnam (Illustration 1) is the third largest delta in the world and has more than 17 million inhabitants. The area is very fertile and the total food production provides food for almost 200 million people. The delta is at a height of on average one metre above sea level and is therefore very vulnerable to both sea-level increases and subsidence. During the past 25 years, the considerable increase in agricultural and industrial activities, urbanization and a significantly growing population have led to a substantial increase in the water and groundwater demand. Whereas at the beginning of this century, about 600,000 m3 groundwater was extracted per day, today it is in excess of 2.5 million m3 per day.

Illustration 1. The Mekong Delta (MKD) in the south of Vietnam (Minderhoud et al. 2017).

The substrate of the Mekong Delta consists of an accumulation of sandy aquifers, which are separated from each other by thick, barely permeable clay layers. In some places, the total thickness of the sediments is more than half a kilometre. Since groundwater and water in the shallow substrate are often of poor quality due to pollution and, to an increasing extent, to salinisation, more and more groundwater is extracted. When more water is pumped from an aquifer than is replenished, the water pressure decreases. As a result, the effective pressure on the matrix of the sediments increases, which can lead to the sediments in the substrate being pressed together (consolidation).
The water extraction has led to a steady decrease in the ground water pressure in almost all the aquifers, as well as in the clay layers. The sandy layers are only susceptible to this to a limited extent. On the other hand, fine-grained deposits such as clay (as well as peat) are easily consolidated. This is one of the main causes of the subsidence in the Mekong Delta.

New hydrogeological model of the Mekong Delta

Within the framework of the ‘Rise and Fall’ project, a Dutch-Vietnamese research project by the University of Utrecht, Deltares and TNO in collaboration with Vietnamese universities and government bodies, research is being carried out into subsidence in the Mekong Delta. One of the research objectives is to determine what influence the increase in groundwater extraction during the past 25 years has had on subsidence.
In order to answer this question, a new 3D hydrogeological computer model was developed on the basis of hydrological, geological and geotechnical data sets. The majority of these data are from the Division of Water Resources Planning and Investigation of the South of Vietnam (DWRPIS), a government body that is part of the Vietnamese Ministry of Natural Resources and Environment. The model was made in iMOD, the open-source Deltares software based on MODFLOW for simulating groundwater flow.
First, a 3D model of the substrate was made on the basis of drill cores and geological cross-sections of the Mekong Delta. Next a hydrogeological model was built on the basis of measurements of precipitation and evaporation and amounts of surface water, including locations of extraction wells with filter depths and pumped volumes of groundwater. Using this model, the development of the groundwater level in the Mekong Delta was simulated for the period 1991-2015. The model was calibrated by comparing the results with 70 time series of groundwater level measurements spread over the delta.
The consequences for the subsidence were calculated by linking the model to a new, geotechnical iMOD module called SUB-CREEP. This module calculates subsidence by determining both the elastic and plastic distortion of the substrate due to a change in the water pressure according to the isotache method.

The effect of increasing water extractions

In the early nineties, the groundwater levels in the substrate of the Mekong Delta were practically undisturbed, but since then the amount of pumped water is many times greater than is replenished by nature. At a number of locations, the water table has fallen by more than 20 metres, for instance around cities such as Ho Chi Minh City and Ca Mau. These considerable pressure reductions have led to an increasing subsidence in the Mekong Delta (Illustration 2a). Whereas in the early nineties the average subsidence in the delta was still less than half a centimetre per year, this rate has now more than doubled. For that matter, it takes some time before the pressure reductions penetrate into the barely permeable clay layers which are the most sensitive to subsidence. As a result, the subsidence reacts with a delay to the decrease in groundwater pressure in an aquifer.

Illustration 2. a) Average annual subsidence as a result of groundwater extraction per five-year period. b-c) Modelled and measured groundwater levels and total subsidence for two locations in the delta, Can Tho City and Long An Province. The fluctuations in the subsidence indicate that the substrate expands during the rainy season and declines during the dry season.

Illustrations 2b and 2c give a detailed picture of both the measured and modelled water levels and subsidence for two locations in the delta. The model appears to simulate the measured water table and subsidence rates fairly well. Illustration 3 shows the modelled total subsidence in the delta as a result of 25 years of groundwater extraction and the subsidence rate in 2015. The Mekong Delta has subsided by approximately 18 centimetres on average with local subsidence towards half a metre. The model indicates that the delta is currently subsiding by an average of 1.1. centimetre per year, with local rates of more than 2.5 centimetres per year. In the area around Ho Chi Minh City, subsidence is more than 4 centimetres per year.

Illustration 3. Left: Total subsidence in the Mekong Delta since 1991. Right: modelled rate of subsidence for 2015 (Minderhoud et al. 2017)

The Mekong Delta is subsiding faster than the sea level is rising

Some parts of the delta are subsiding by several centimetres per year and this rate of subsidence is increasing. The rates are much higher than the sea-level increase due to climate change (the absolute sea-level increase locally is 3 millimetres per year). These are alarming results, because due to its low location of on average 1 metre above sea level, the Mekong Delta is very sensitive to subsidence. During the past 25 years, the delta has lost about 20 percent of its total height above sea level. This problem will only increase in the near future.
The subsidence in the delta is determined by the sum of various factors: sea level increase, and subsidence due to groundwater extraction but also due to other processes, such as natural compression (compaction) and the deposit of new sediment during floods. In a natural situation, these processes are in a dynamic balance and sedimentation compensates for the subsidence. However, the amount of sediment in the Mekong river is decreasing as a result of upstream dams and the increasingly effective dyke system in the delta ensures less floods. Furthermore, the delta is now subsiding many times faster than can be compensated for by sedimentation at all.
In order to prevent the drowning of the Mekong Delta within a few decades, the groundwater use must be considerably reduced in the short term. This requires large-scale changes such as setting up alternative fresh water facilities (for instance filtered surface water). Decisive and resolute measures are necessary in order to ensure that the Mekong Delta will remain above sea level in the future.

To future scenarios for mega deltas

The modelling approach used in combination with the new subsidence model allows us to quantify the effects of groundwater extraction for large areas, in this case a mega delta. In principle, this approach can be applied to every area where groundwater is extracted, provided that enough data are known about the substrate and the hydrology (groundwater levels and extractions). In addition, these types of models offer the possibility of calculating future scenarios. As a result it will be possible to issue thorough advice, for instance to support the development of delta management strategies. This is therefore the following step in the subsidence study of the Rise and Fall project, with the objective of being able to contribute to a sustainable future for the Mekong Delta.

Philip Minderhoud
(Utrecht University / Deltares)

Link to the video abstract of this study.

Background picture:
In the Mekong Delta, much transport takes place over water. (Photo: ©Philip Minderhoud)


Summary

During the past 25 years, the groundwater extraction in the Vietnam Mekong Delta has increased considerably as a result of the strongly growing economy and the increasing population. Since the large-scale extraction far exceeds the natural replenishment of the groundwater, everywhere in the delta the soil has subsided. In particular the clay layers between the aqueous sand layers are settling. The current rates of subsidence are up to ten times higher than the sea-level rise as a result of climate change. Using a new 3D hydrogeological model of the Mekong Delta, the groundwater flow and extraction for the past 25 years have been simulated. The model is linked to a module with which the subsidence has been calculated. The next step with this modelling approach is to generate future scenarios for the delta.


Sources


Minderhoud, P.S.J., Erkens, G., Pham, V.H., Bui, V.T., Erban, L., Kooi, H., Stouthamer, E., 2017. Impacts of 25 years of groundwater extraction on subsidence in the Mekong delta, Vietnam. Environ. Res. Lett. 12. doi:10.1088/1748-9326/aa7146

^ Back to start

DROWNING MEKONG DELTA

Pumping of groundwater

Knowledge journal / Edition 1 / 2018

Subsidence in the Dutch peat regions: extent and social costs

Subsidence and consolidation in peat regions lead to social costs. In rural regions, the peat subsidence is the result of oxidation and settlement which occur when the groundwater level is lowered. The deeper the dewatering, the faster the subsidence. Modern agriculture is only possible in well dewatered ground, due to the required carrying capacity. In urban regions, it concerns subsidence or compression of the ground. Unequal settlement in particular leads to damage to buildings and the infrastructure.

To show what the consequences are of subsidence and what action options there are for administrators in peat regions, the Netherlands Environmental Assessment Agency, supported by STOWA, has written a policy study: ‘Dalende bodems, stijgende kosten’ (‘Subsiding ground, rising costs’ (van den Born et al. 2016)). This study gives an insight into measures for slowing down subsidence in rural regions and dealing with subsidence in a smart way in built-up regions. In this article we will limit ourselves to rural regions.

The study

In order to gain insight into the consequences of subsidence, a comparison was made between subsidence in the case of continuing with the current policy and in the case of an alternative policy. The current policy, level indexation, means that periodically (for instance every ten years) the groundwater level is lowered so that it is at the same depth below ground level as ten years ago.
There were two research questions:
- Can we calculate the future subsidence, in the case of continuing with the current policy and in the case of slowing down the subsidence?
- What are the costs and benefits of subsidence, and of measures against subsidence?
The subsidence was calculated using the GIS-based subsidence model Phoenix. In this way, the large variation in ground formation and dewatering in the western and northern peat regions could be included. Important inputs were the updated peat ground map (2014), hydrological data from the water authorities and land use data. Phoenix calculates using the empirically based relation between dewatering and subsidence (van den Akker, 2008). For each grid cell, the subsidence was determined for almost all the peat regions in the Netherlands for different forms of management (for the horizon of 2050).

For determining the costs and benefits, the guideline for social costs-benefits analysis was used (CPB & PBL 2013). There was specific consideration to extra costs for the water management, the impact on crop growth and climate costs. The extra costs concern increasing barriers, placing and adjusting weirs and pumping polder water to the storage basin over a greater height. The costs for this were estimated on the basis of expert knowledge of water authorities.
The crop loss was determined using an improved set of HELP tables, in which the relation between crop growth, soil type and groundwater levels were indicated (van Bakel 2016). The climate costs were defined as the costs as a result of the emission of greenhouse gasses due to subsidence. Since the climate agreement of Paris, this will be part of the climate policy after 2020.

Measures to slow down the subsidence

Three measures were calculated which will slow down the subsidence: level fixation, underwater drainage and other land use. For level fixation, the existing level is retained and due to the subsidence in the course of time raised water levels will occur. Underwater drainage contributes to a stable groundwater level as a result of which the peat substrate remains sufficiently wet and oxidation is limited as much as possible. Both measures help to combat peat subsidence but they differ in their effects and secondary effects. Level fixation offers opportunities for biodiversity but leads to lower crop yields for farmers. Underwater drainage is better suited to more intense land use. The third measure is other land use: function adjusted to nature or to another adapted agriculture with wet production conditions. This will ultimately lead to a complete halt in the subsidence.

Results for subsidence

The calculations show that the average subsidence in the peat regions researched is 8 to 9 millimetres per year. In forty years, the subsidence is an average of 34 centimetres. In the northern peat regions, the dewatering is more than 90 centimetres in large parts. The average subsidence is higher there (11-12 mm per year) than in the western peatland meadow regions (7–10 mm per year), where the dewatering is between 40 and 80 centimetres.

Figure: Subsidence up to 2050 in the case of an unchanged level management and level fixation

Costs and benefits of subsidence

In the case of continuing with the current policy, the costs for the water authorities due to peat subsidence will increase to a limited extent. The extra costs have been estimated at € 200 million over a period of 40 years (cumulative and at the current price level). Measures which lead to less subsidence (level fixation or underwater drainage) result in less extra costs. The cumulative saving can go up to € 50 million. An important comment here is that for underwater drainage for instance adjustments in the water system will be necessary; the extra costs for this, for instance for water storage and extra water supply, have not been included.

Table: extra costs for water management for measures against subsidence 2010-2050 (cumulative, in millions of euros). Underwater drainage applied to 82,000 hectares (lower costs per hectare), the rest is level indexation (high costs per hectare). The costs for underwater drainage therefore give a distorted picture.

In addition, there are costs due to climate change. If we assume the reported emission of 4.2 million tons of CO2 in the National Emission Inventory (Coenen et al. 2017), the annual cost item will be about € 120 million (for a CO2 price of € 30 per ton). Per hectare, it concerns an average annual cost item of € 250 to € 300. The benefit of the dewatering is especially the value of the crop production, in this case the grass produced as cattle feed.

Costs and benefits of measures

For agriculture, underwater drainage appears to be a good alternative. The costs for this (depreciation and maintenance) are an annual amount between € 200 and € 300 per hectare. Underwater drainage has advantages for the operational management such as a better and longer accessibility of plots. It appears that this investment in less subsidence can reasonably measure up against the climate cost.
Other measures, such as an adapted level management, a flexible or a fixed level, lead to a gradual decrease in the subsidence, but there is the risk that the crop growth will decrease. In many places the crop loss could increase to many hundreds of euros per hectare per year.
Subsidence also causes damage to buildings and infrastructure. The extra costs for the infrastructure in rural regions for the period 2010-2050 is estimated at between € 300 million and € 1 billion, and the one-off costs for repairing foundations at € 0.5 to € 1.0 billion (price level 2010). In villages in the outlying areas which fall under the same level management as the polder which they form part of, high water provisions are an option. This is expensive and also requires maintenance (Hartman, 2012).

Policy alternatives

The three previously mentioned measures, level fixation, underwater drainage and change in land use have been elaborated into a number of policy alternatives. Policy alternative ‘mitigating measures’ assumes underwater drainage and the policy alternative ‘passive rewetting’ assumes the maximum application of level fixation. The policy alternatives ‘function linkage’ and ‘function separation’ represent a wider palette of existing and new forms of land use. Which approach suits the best is local custom work and also depends on the local situation such as peat layer thickness, seepage and the risk of salinisation.
As well as subsidence, the development of the water management of a region and the future perspectives for agriculture also have to be included. The rising sea level leads to a greater seepage pressure in the coastal zone with greater risks of salinisation. As a result of further subsidence in peat regions which border on river valleys, drying-out can occur in the flanks of the river valleys (this occurs for instance in the low central region of Friesland).
Implementation of measures against subsidence requires an integral spatial consideration, partly based on a clear vision of the future of the region.

Discussion

The use of the subsidence model Phoenix offers the possibility of calculating the subsidence for the various peat regions. A weak point is that the empirical relation used between dewatering and subsidence has been applied to all peat soils. In this way, the difference between the various types of peat (peat moss, reed peat, sedge peat and forest peat) is not sufficiently apparent. The plot size does not play a role either (relevant for underwater drainage). More custom work is also desirable regarding the costing. In addition, sufficient field experiments for being able to substantiate the effects of underwater drainage or level fixation are lacking.
There is more and more attention to the consequences of subsidence in the long term and for climate mitigation and climate adaptation. It is important to adapt the research agenda on this point. For field experiments it is important to look integrally at the consequences of subsidence for crop growth and biodiversity. Region-specific knowledge can also play an important role in dealing more consciously with subsidence in rural regions.

Gert Jan van den Born
(Planbureau voor de Leefomgeving (The Netherlands Environmental Assessment Agency))
Michelle Talsma
(STOWA)
Jos Schouwenaars
(Wetterskip Fryslân (Friesland Water authority))

Summary

The Netherlands Environmental Assessment Agency and STOWA carried out a study into the social costs of subsidence in peat meadow regions and possible measures against subsidence. The application of underwater drainage appears to be the most favourable for agriculture as it is now practised. Level fixation offers opportunities for adapted agricultural functions with attention to natural objectives. Other land use can respond to the social need for recreation as well as offer space for new agricultural earning models. Slowing down subsidence will lead to lower emissions of CO2. Investing in less subsidence appears a fairly favourable measure for lowering the emission of greenhouse gases.


References


Akker, J.J.H. van den et al. (2008). Emission of CO2 from agricultural peat soils in the Netherlands and ways to limit this emission, pp. 645-648 in: Proceedings of the 13th International Peat Congress After Wise Use – The Future of Peatlands, Vol. 1 Oral Presentations, Tullamore, Ireland, 8 – 13 June 2008. Jyväskylä, Finland: International Peat Society.

Bakel, J. van (2016). Waterbeheer in de veenweidegebieden in Nederland en de gevolgen voor de agrohydrologische situatie en de bedrijfsvoering van melkveebedrijven. Notitie t.b.v. PBL-project ‘bodemdaling laagveengebieden’ (Water management in the peat meadow regions in the Netherlands and the consequences for the agro-hydrological situation and the operational management of dairy farms. Memorandum for the purpose of the PBL project ‘subsidence in low peat regions’). The Hague: The Netherlands Environmental Assessment Agency.

Coenen P.W.H.G., et al. (2017). Greenhouse gas emissions in the Netherlands 1990-2015: National Inventory Report 2017. RIVM Report 2017-0033

CPB & PBL (2013). Algemene leidraad voor maatschappelijke kosten–batenanalyse (General guideline for social costs-benefits analysis). The Hague: CPB/PBL.

Hartman, A., J.M. Schouwenaars and A, Moustafa (2012) De kosten voor het waterbeheer in het veenweidegebied in Fryslân (The costs for the water management in peat meadow regions in Friesland). H2O 12

Van den Born, G.J., F. Kragt, D. Henkens (PBL-STOWA), B. Rijken, B. van Bemmel en S. van der Sluis (2016). Dalende bodems, stijgende kosten, mogelijke maatregelen tegen veenbodemdaling in het landelijk en stedelijk gebied (Subsiding ground, rising costs, possible measures against peat subsidence in rural and urban regions). PBL publication number 1064. The Hague: The Netherlands Environmental Assessment Agency

^ Back to start

PEAT REGIONS

Subsidence: extent & social costs

Knowledge journal / Edition 1 / 2018

Bayesian Belief Networks: new promising tool for water system analyses

STOWA (Netherlands Foundation for Applied Water Research) has developed a diagnostic tool which gives insights into the relationships between system characteristics and the ecological condition of water bodies: the Ecological Key Factors (EKFs). A feature is that each EKF exposes a part of the system functioning of surface water. A tool with which the connection between various EKFs can be quantified is lacking. Can Bayesian Belief Networks provide this connection?

Many water bodies in the Netherlands do not meet the objectives of the Water Framework Directive (WFD). In order to improve the ecological quality of these water bodies, it is important to gain insights via a water system diagnosis into the causes of inadequate water quality.
In the STOWA EFK methodology, nine key factors are used which, as independently of each other as possible, each explain a part of the ecological functioning of a water system. However, in practice, these key factors interact, revealing a need to make these interactions transparent for a fuller understanding of the system. A tool with which, in addition to the relationship between the EFKs and the ecological quality of water bodies, the connection between various EFKs can also be quantified, was lacking up until now.
Commissioned by STOWA, i the project ‘Linking ESFs’ (‘Linking EKFs’) by a consortium of Deltares, NIOO and Witteveen+Bos, developed such a diagnostic tool.. The consortium used a specific statistical technique, i.e. Bayesian Belief Networks (BBNs), which have been increasingly applied in recent years for nature conservation and water resource management. A BBN is characterized by a causal network, within which all the relationships between various factors are recorded on the grounds of expert knowledge, models and/or measurementsBased on an established network, the tool calculates what the probability is of a particular outcome for specific regional conditions (both of the final ecological quality and of all the intermediate factors).
For establishing and quantifying the causal relations within the BBNs, use has been made of many applied knowledge rules which are anchored in existing models such as Uitzicht, Baggernut, PCDitch, PCLake and the Nürnberg P-model for deep lakes. Since the tools developed for the EFKs did not appear to be adequate for completing the BBNs, the projectgroup made other scientific knowledge rules operational. IHere,we describe briefly what a BBN is, how it can be applied – illustrated by a deep lakes case study – and what the future developments will be.

What is a BBN?

A BBN consists of a graphical model of causal relationships between the system characteristics and ecosystem quality (nodes), which are connected to each other by means of arrows (processes). The causal relationship between a parent node (cause) and a child node (consequence) is quantified through a discretizated probability distribution, whereby the probability of a particular outcome for the child node is determined by the probability distribution for the parent node and the type of relationship that there is between the two. The BBNS are essentially a map of the probability distributions. The links between EFKs are explicitly identified as well as (a) the uncertainty regarding the (interim) outcomes and (b) the importance of causal paths.
In our BBNs, on the basis of a set of system characteristics, such as depth, discharge and nutrient load, it is determined what important role all the processes play in achieving the ecological condition in stagnant water, where a distinction is made between the shallow lake zone, the deep lake zone and the ditch zone. The figure below shows a simplified example of the deep lake zone BBN.


Advantages and disadvantages of BBNs

One of the great advantages to a BBN is the unambiguous and transparent way in which not only the final result but also all the interim steps are made transparent. In addition, a BBN shows how uncertainty in interim steps affects the end state. Together, these characteristics give a better understanding of the ecological functioning of the water system.
A possible disadvantage is that feedback loops cannot be modelled within a BBN. An example of such feedback is the positive reinforcement effect of water transparancy on aquatic plants and vice versa. On the one hand, the increased light availability steers the aquatic plant growth, on the other hand aquatic plants themselves can also increase water transparancy. In our approach to the BBNs, we have overcome this disadvantage by using metamodels. A metamodel is simply a large table with input values and corresponding output values for a given mechanistic model. Since we have made metamodels from mechanistic models (in which such feedback loops have been anchored), we have overcome this disadvantage as much as possible. This method of work has been applied by making a different use of the ecosystem models PCLake and PCDitch.
Furthermore, only equilibrium scenarios can be calculated using BBNs. For processes which vary considerably in time or space, other models must be resorted to, or a BBN must be calculated for various scenarios, for instance winter versus summer scenarios.

Application in water management

A good diagnostic tool that supports water authority officials in their water system analyses must meet a number of criteria. Firstly, the tool must give extra insights into the functioning of the ecosystem. For this purpose, the relations between various processes which determine the ecological quality must be transparent. Furthermore, the tool must produce reliable outcomes and give insights into the effects of (un)certainties in the quality of input data and the reliability of knowledge rules. For the sake of user friendliness, it is important that the interim steps and the final result are presented in an intuitive manner.

The reliability of the BBN was tested on the basis of a tiered validation procedure which we describe here on the basis of the BBN for deep lake zones. In order to test the causal relations against the expectations, extreme input values were explored; these results were good. As an illustration: if we calculated a situation with a low external P load (<0.001 mg P/m2/day) and a high fish biomass (>381<488 kg/ha), the BBN gave a relatively high probability of both turbid water with little algae (42%) and a clear, oxygen quality (29%). This is what you would expect at the lake bottom where burrowing fish resuspend organic matter and the related increase in turbidity. In addition, it is also logical that the probability of a an oxygenated hypolimnion is relatively high, given the extremely low external load.
For exploring the deep lake zone BBN based on more realistic values, the waterboard Waternet made data available about the Spiegelplas. The Spiegelplas is a deep sand pit (average depth = 16.9 metres) which is characterized by the large presence of Quagga mussels. The input values of the Spiegelplas (Figure 2, top panel) give, according to the tool, a relatively high probability of a biotic turbid lake where the top layer of the water column is dominated by the presence of fytoplankton species other than cyanobacteria. However, due to the presence of the Quagga mussel with a large filtration capacity, the current conditions are in reality much less turbid.

In accordance with expectations, the drastic reduction in the external P load gives a large probability of a low turbidity lake with an oxygenated hypolimnion (70%, Figure 2, middle panel). When we test a scenario whereby the release increases in relation to the current situations, the probability of a biotic turbid lake, dominated by cyanobacteria increases (55%, Figure 2, bottom panel). Due to the exploration of the BBN on the basis of the realistic values of the Spiegelplas case study, rather more subtle results also emerge. They result from the rather coarse classes of the probability distribution tables, the minimum and maximum values are sometimes extreme, and the width of the classes are sometimes illogical. The class boundaries were made in the first instance via a computer algorithm; in a potential follow-up route, the class boundaries must be determined with a more extensive study.


Developments for the future

The tool in its current form provides additional insights into the functioning of the system, makes the interactions between both system characteristics and ecosystem qualities insightful and transparent, and clearly depicts (un)certainties in knowledge and outcomes. Within a supplementary route, extra validation steps in case studies will increase the reliability of the (interim) results and the user- friendly interface will be expanded. The elaboration of the tool in its current form was aimed at the implementation of knowledge rules of processes which form the foundation of ESF1-4. We recommend to include knowledge rules of the other ecological key factors in the BBNs.

Conclusion

Deltares, NIOO and Witteveen+ Bos have shown that the application of this type of BBNs for water management is promising. The importance of various processes in realizing ecological states is made explicit within the tool. At the same time, all the interim results are completely transparent for the water authority official, as a result of which there is no question of a black box model. These interim results fit well with the practical information that waterauthorities collect in the field, such as expected chlorophyll-A-concentrations, plant cover, etc. In addition, it also becomes clear what uncertainties are related to such diagnoses. This tool will support water authorities in creating understanding of the system, and therefore in establishing realistic objectives and efficient measure packages.

Lisette N. de Senerpont Domis
(NIOO-KNAW)
Lilith Kramer
(Deltares)
Bob Brederveld
(Witteveen+Bos)

Summary

For the improvement of ecological water quality, it is important to gain insights via a water system diagnosis into the causes of the inadequate quality. In order to support system diagnostics, STOWA has developed the ecological key factors system (EKFs) which gives insights into the relations between system characteristics and the ecological quality of water bodies. A tool which, in addition to being able to quantify the relation between the EKFs and the ecological quality of water bodies, can also quantify the connection between various EKFs, was lacking up until now. Deltares, NIOO and Witteveen+Bos have developed a tool founded on Bayesian Belief Networks, where the importance of various system characteristics and processes in realizing ecological states of a water body are made explicit. Interim results are transparent for the water authorites and fit well with the practical information that they collect in the field. It also becomes clear what uncertainties are related to such diagnoses. This tool will support water authority officials in creating understanding of the system, and therefore in establishing realistic objectives and efficient measure packages.

^ Back to start
BAYESIAN BELIEF NETWORKS

Tool for water system analyses

Archive


Edition 1/2015


Edition 2/2015


Edition 1/2016


Edition 2/2016


Edition 1/2017


Edition 2/2017

ARCHIVE

Previous editions

Knowledge journal / Edition 1 / 2018

ABOUT WATER MATTERS

The knowledge section Water Matters of H2O is an initiative of


Royal Dutch Waternetwerk
Independent knowledge networking organisation for and by Dutch water professionals.


Water Matters is supported by

Alterra Wageningen University
Research institute that contributes by qualified and independent research to the realisation of a high quality and sustainable green living environment.


ARCADIS
Global natural and built asset design and consultancy firm working to deliver sustainable outcomes through the application of design, consultancy, engineering, project and management services.


Deltares
Independent institute for applied research in the field of water, subsurface and infrastructure. Throughout the world, we work on smart solutions, innovations and applications for people, environment and society.


KWR Watercycle Research Institute
Institute that assists society in optimally organising and using the water cycle by creating knowledge through research; building bridges between science, business and society; promoting societal innovation by applying knowledge.


Royal HaskoningDHV
Independent international engineering and project management consultancy that contributes to a sustainable environment in cooperation with clients and partners.


Foundation for Applied Water Research (STOWA)
Knowledge centre of the regional water managers (mostly the Water Boards) in the Netherlands. Its mission is to develop, collect, distribute and implement applied knowledge, which the water managers need in order to adequately carry out the tasks that their work supports.


Netherlands Water Partnership
United Dutch Water Expertise. A network of 200 Dutch Water Organisations (public and private). One stop shop for water solutions, from watertechnology to coastal engineering, from sensor technology to integrated water solutions for urban deltas.

ABOUT WATER MATTERS